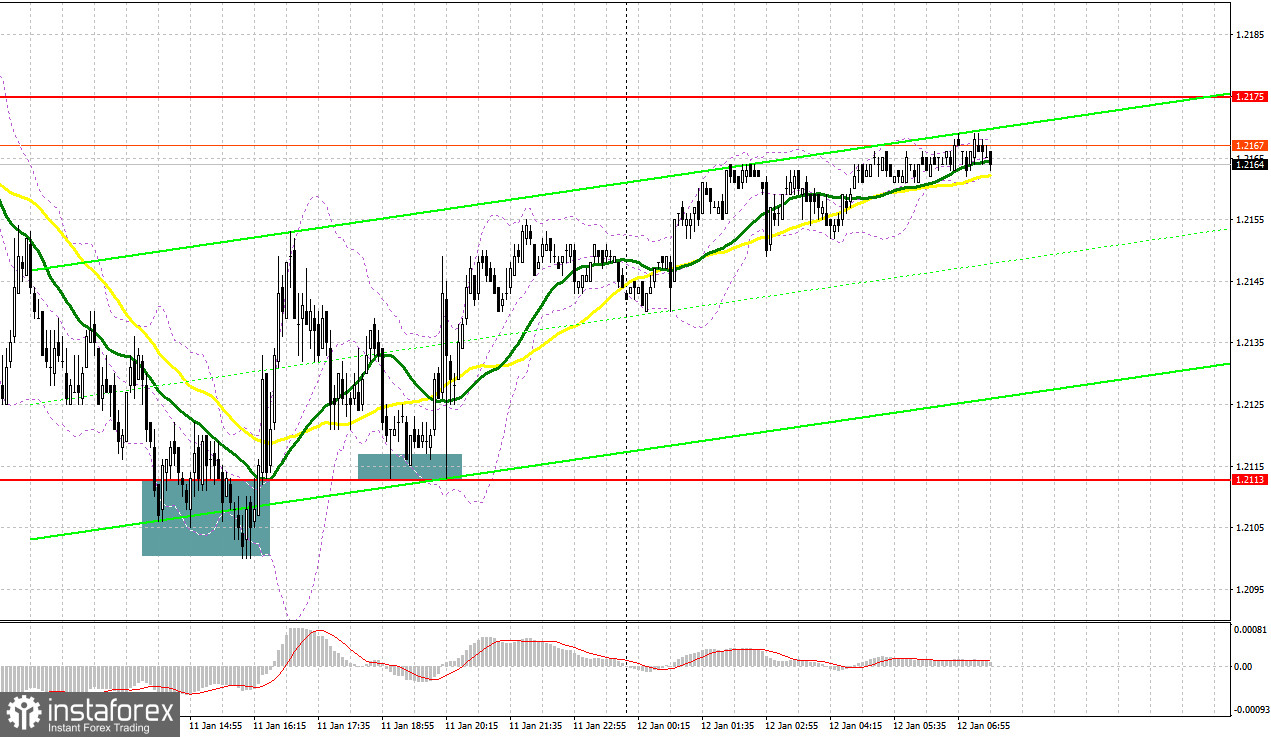
There were several entry signals yesterday. Let us have a look at the 5-minute chart and figure out what happened. In my morning forecast I highlighted the level of 1.2142 and recommended making market entry decisions with this level in mind. GBP/USD descended to this level, but did not perform a false breakout and the upward retest. As a result, there were no market entry signals in the first half of the day. During the US session, the pair performed a false breakout of 1.2113 and created a buy signal, pushing the pound sterling up by 40 pips. GBP/USD later moved up by 30 pips after another similar false breakout.

When to open long positions on GBP/USD:
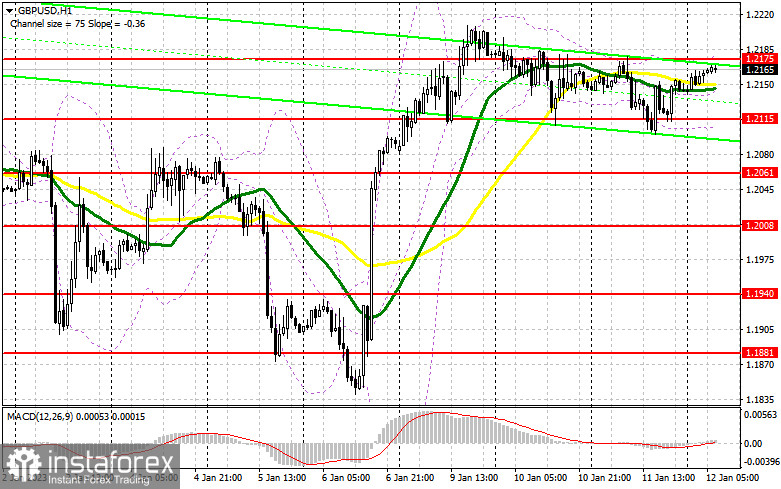
The pound sterling has upside potential and remains within the trend channel, but a new uptrend requires inflation in the US to decrease. This will lead to renewed demand for risky assets, pushing up the pair. In the first half of the day, the lack of statistic data will negatively affect bullish traders, which may lead to a slight downward correction towards the new lower boundary of the sideways channel at 1.2115. The speech by Bank of England's representative Catherine L. Mann is unlikely to push the pound sterling out of this channel. In the second half of the day, traders will focus on the level of 1.2115. A false breakout of this level, which has already been tested before several times over the past couple of days, will create an optimal buy signal. This level already formed an entry signal yesterday. This will establish a new stronger uptrend which may then create a new support level and break above the resistance at 1.2175. After settling above this level, GBP/USD may surge and test 1.2234. Lower inflation in the US may push the pair to 1.2301, where I recommend taking profits. If bulls lose 1.2115 in the first half of the day, it will increase pressure on GBP/USD, resulting in a downward correction triggering the stop loss orders of bulls below it. Because of that, traders are recommended to open long positions if the pair performs a false breakout below the low at 1.2061. You can also buy GBP/USD immediately if it bounces off 1.2008 targeting an intraday correction of 30-35 pips.
When to open short positions on GBP/USD:
Bears are unlikely to make any aggressive moves until the release of key US data. While the pair is very likely to start a correction towards 1.2115, the same cannot be said about creating a new sell signal there. The best opportunity for opening short positions is if the pair performs a false breakout of 1.2175, which might be followed by a strong move towards 1.2115 in the first half of the day. A breakout and an upward retest of this level will put an end to the pair's upward momentum and create a sell signal. From there, GBP/USD may perform a bigger downward correction to 1.2061. Below it lies 1.2008, where I will be taking profits. GBP/USD may hit this level only following the news about another inflationary spiral in the US at the end of last year. If the pair moves up and bears are inactive at 1.2175, it will extend the bullish trend. In this scenario, an entry point for opening short positions will only be formed if the pair performs a false breakout of 1.2234. If there is no activity there as well, you can sell GBP/USD immediately if it bounces off the high at 1.2301, targeting a downward intraday correction of 30-35 pips.

Commitment of Traders (COT) report:
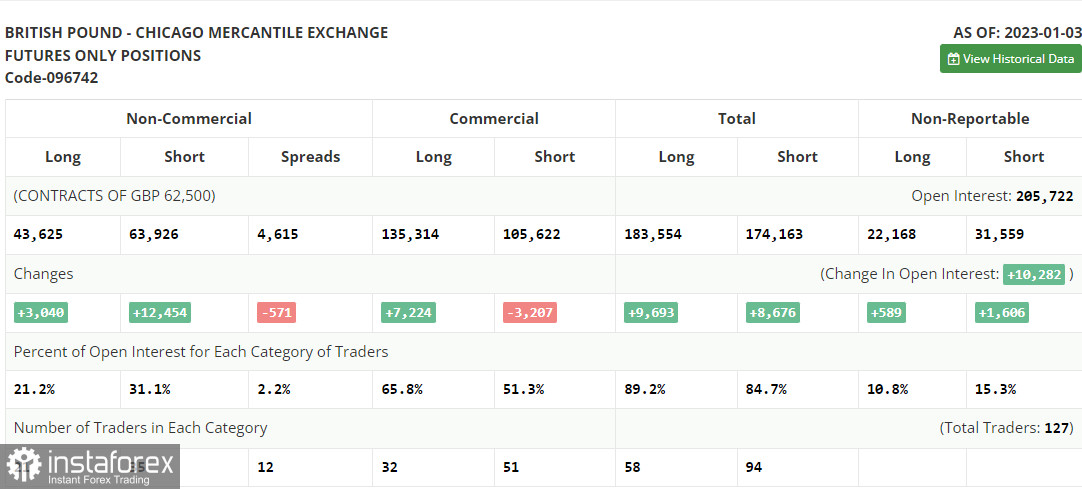
The COT report (Commitment of Traders) for January 3 noted an increase in long and short positions. Short positions increased nearly fourfold, which clearly indicates that traders do not see the pound sterling rise at the beginning of 2023. With the regulators having no intention to change their policy and halt interest rate hikes, this does not bode well for the pound. The economy is already in recession and the Bank of England is also going to cut interest rates, which will limit GBP's upside potential. If US inflation data, which is due soon, shows that consumer prices went up, there will definitely be no pound sterling uptrend in the first quarter of 2023. According to the latest COT report, short non-commercial positions jumped by 12,454 to 63,926, while long non-commercial positions increased by 3,040 to 43,625, which brought the negative non-commercial net position down to -20,301 versus -5,603 a week earlier. This once again indicates there are no buyers willing to buy the pound at the current highs. The weekly closing price decreased to 1.2004 from 1.2177.

Indicators' signals:
Moving averages
Trading is carried out near 30 and 50-day moving averages, which indicates that the pair is moving sideways ahead of the release of key data.
Note: The period and prices of moving averages are considered by the author on the H1 (1-hour) chart and differ from the general definition of the classic daily moving averages on the daily D1 chart.
Bollinger Bands
If GBP/USD moves up, the upper boundary of the indicator at 1.2175 will serve as resistance.
Description of indicators
Moving average (moving average, determines the current trend by smoothing out volatility and noise). Period 50. It is marked yellow on the chart. Moving average (moving average, determines the current trend by smoothing out volatility and noise). Period 30. It is marked green on the chart. MACD indicator (Moving Average Convergence/Divergence - convergence/divergence of moving averages) Quick EMA period 12. Slow EMA period to 26. SMA period 9 Bollinger Bands (Bollinger Bands). Period 20 Non-commercial speculative traders, such as individual traders, hedge funds, and large institutions that use the futures market for speculative purposes and meet certain requirements. Long non-commercial positions represent the total long open position of non-commercial traders. Short non-commercial positions represent the total short open position of non-commercial traders. Total non-commercial net position is the difference between the short and long positions of non-commercial traders. English
 Русский
 Bahasa Indonesia
 Bahasa Malay
 ไทย
ไทย Español
 Deutsch
 Български
 Français
 Tiếng Việt
 中文
中文 বাংলা
বাংলা हिन्दी
 Čeština
 Українська
 Română

