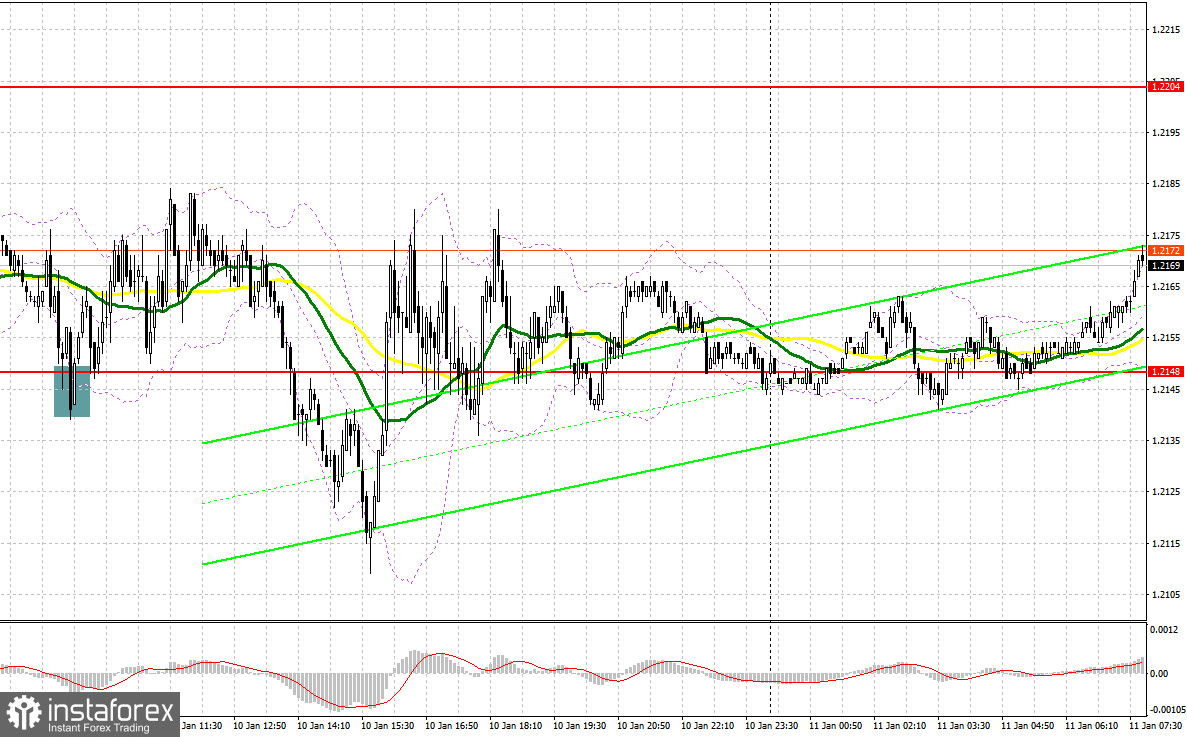
There was only one signal generated yesterday. Let's take a look at the M5 chart to get a picture of what happened. In the previous review, we focused on the 1.2148 mark and considered entering the market there. Decline and a false breakout through the level in the course of the European session made a buy signal in continuation of the uptrend. As a result, the pair rose by about 35 points. During the US session, despite the breakdown and the pair going back to the same mark, I did not see any signals to enter the market.

When to go long on GBP/USD:
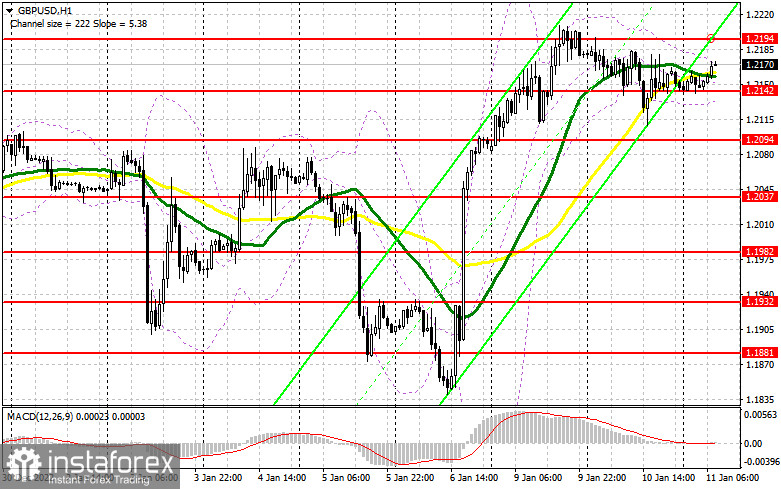
The Federal Reserve Chairman's speech had a positive effect on the pound, which helped bulls regain control of the 1.2148 mark yesterday afternoon. However, Powell did not mention the future of the monetary policy, which kept the market in balance before tomorrow's inflation report. Since we don't have fundamental reports that we can assess today, the bulls will probably use the momentum and try to pull the pair to a new monthly high. But in my opinion, a better buy signal would be a false breakout around the disputable support at 1.2142, which was tested several times in the past few days and from which an entry signal was generated yesterday. After that we can expect a stronger bullish momentum and a lower limit of a new ascending channel with the prospect of crossing resistance at 1.2194. After consolidating in this range, I expect a sharper upward movement from the pound, and growth to 1.2260. Meanwhile, a breakout through this mark with a similar test may result in growth to 1.2301 where it is wiser to lock in profit. If GBP/USD goes down and there is a lack of bullish activity at 1.2142, the pressure on GBP/USD will increase, which will lead to a bit of a bearish correction and this will affect the bulls' stop orders. For this reason I wouldn't rush to buy: For this reason I suggest not to rush to buy: it is better to open long positions on a decline and false breakout around the low at 1.2094. It will also become possible to buy GBP/USD on a rebound from 1.2037, allowing a correction of 30 to 35 pips intraday.
When to go short on GBP/USD:
Bears are unlikely to behave aggressively after yesterday's series of setbacks. So the best thing to do now is protect 1.2194, a new resistance, which was formed yesterday. If the pair does not go higher than that, some traders will likely sell again before tomorrow's inflation report, counting on a small correction of the pound to the 1.2142 mark, which is in line with bullish moving averages. A breakout and a retest of this mark to the upside will create a sell entry point with the target at the low of 1.2094, which will be regarded as a deeper downtrend. A more distant target is seen at 1.2037 where it is wiser to lock in profits. In case of growth in GBP/USD and the absence of the bears at 1.2194, a new bullish trend will continue. In this case, a sell entry point will form after a false breakout around 1.2260 with a bearish target. If there is no trading activity there, sell GBP/USD right from the high at 1.2301, allowing a bearish correction of 30 to 35 pips intraday.

COT report:
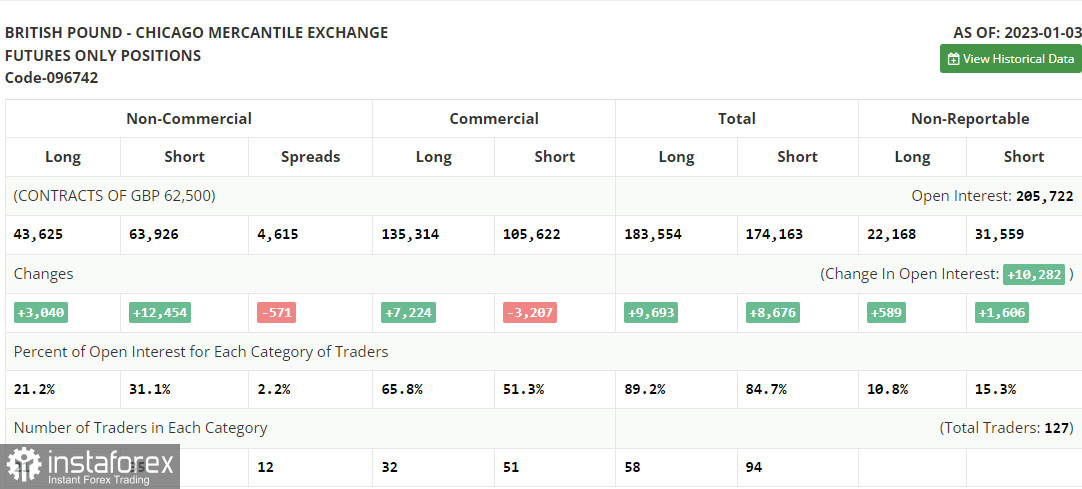
Before we look at the chart, let's turn to the futures market. The COT report for January 3 logged a rise in long and short positions with the number of longs exceeding the number of shorts almost four times. This shows that the bulls have little faith in a stronger pound at the beginning of the year. The fact that world regulators are determined to continue the tightening cycle bodes no well for the pound. The UK is already in a recession. The Bank of England is planning to cut interest rates, which is another restraining factor for the currency. If US inflation accelerates again, we will hardly see a stronger sterling in the first quarter of the year. According to the latest COT report, short non-commercial positions increased by 12,454 to 43,625 and long non-commercial positions grew by 3,040 to 43,625. Consequently, the non-commercial net position came in at -20,301 from -5,603 a week ago, which reflects the bulls' unwillingness to buy the pair at the current highs. The weekly closing price of GBP/USD decreased to 1.2004 versus 1.2177.

Indicator signals:
Moving averages
Trading is carried out near the 30-day and 50-day moving averages, indicating weak prospects for further gains in the pound.
Note: The period and prices of moving averages are viewed by the author on the hourly chart and differ from the general definition of classic daily moving averages on the daily chart.
Bollinger Bands
If GBP/USD rises, the indicator's upper limit at 1.2175 will serve as resistance.
Indicator description:
- Moving average (MA) determines the current trend by smoothing volatility and noise. Period 50. Colored yellow on the chart.
- Moving average (MA) determines the current trend by smoothing volatility and noise. Period 30. Colored green on the chart.
- Moving Average Convergence/Divergence (MACD). Fast EMA 12. Slow EMA 26. SMA 9.
- Bollinger Bands. Period 20
- Non-commercial traders are speculators such as individual traders, hedge funds, and large institutions who use the futures market for speculative purposes and meet certain requirements.
- Long non-commercial positions are the total long position of non-commercial traders.
- Non-commercial short positions are the total short position of non-commercial traders.
- Total non-commercial net position is the difference between the short and long positions of non-commercial traders.
 English
 Русский
 Bahasa Indonesia
 Bahasa Malay
 ไทย
ไทย Español
 Deutsch
 Български
 Français
 Tiếng Việt
 中文
中文 বাংলা
বাংলা हिन्दी
 Čeština
 Українська
 Română

