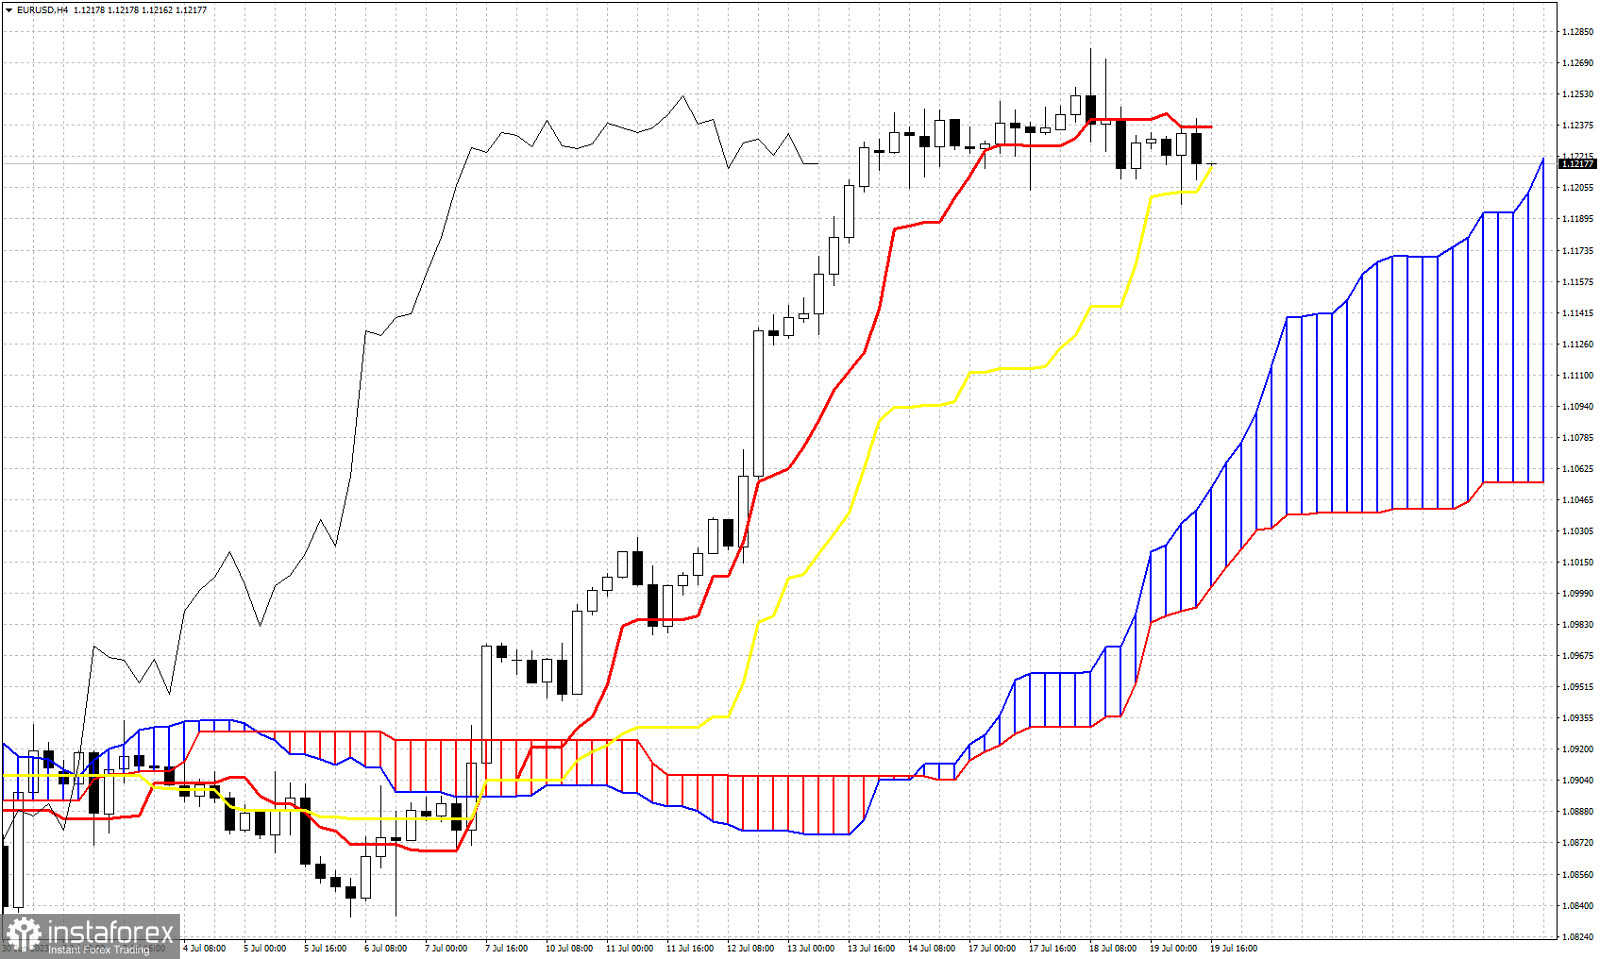
According to the Ichimoku cloud in the 4 hour chart, trend in EURUSD is still bullish. Why did we choose to check the 4 hour chart today? Because after such a bullish run, the time for a pull back is approaching and we use the Ichimoku cloud indicator to identify key support levels. Currently price is well above the Kumo (cloud), but is trading below the tenkan-sen (Red line indicator). This is our first warning. The Chikou span (black line indicator) remains above the candlestick pattern (bullish). This changes if price breaks below 1.1160. Key short-term support is the kijun-sen (yellow line indicator) that if broken will lead price lower towards the cloud support. Currently the kijun-sen is at 1.1215. If broken, cloud support at 1.1050-1.1150 should be tested.
 English
 Русский
 Bahasa Indonesia
 Bahasa Malay
 ไทย
ไทย Español
 Deutsch
 Български
 Français
 Tiếng Việt
 中文
中文 বাংলা
বাংলা हिन्दी
 Čeština
 Українська
 Română

