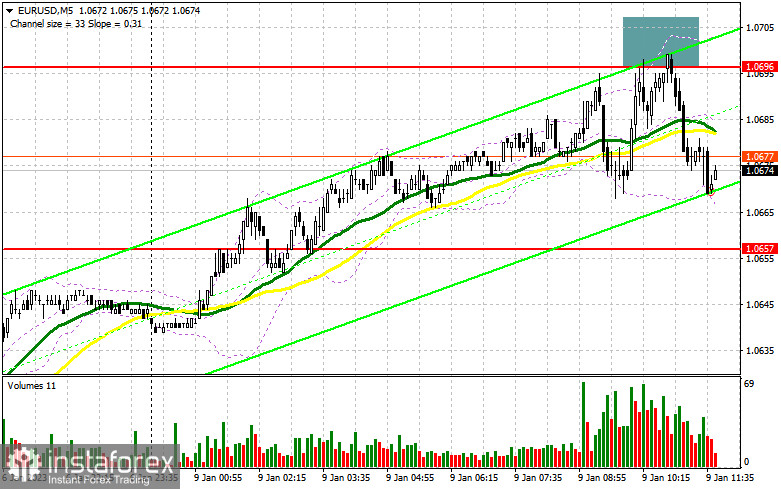
I focused on the 1.0696 level in my morning forecast and suggested making considerations about joining the market there. Let's analyze the 5-minute chart to see what transpired there. After the bullish momentum that has been seen since last Friday, growth and the establishment of a false breakout around 1.0696 all contributed to a signal to sell the euro. The decline was roughly 25 points as of the time of writing. Technically speaking, nothing has changed, and neither has the plan itself.

For EUR/USD long positions, the following is required:
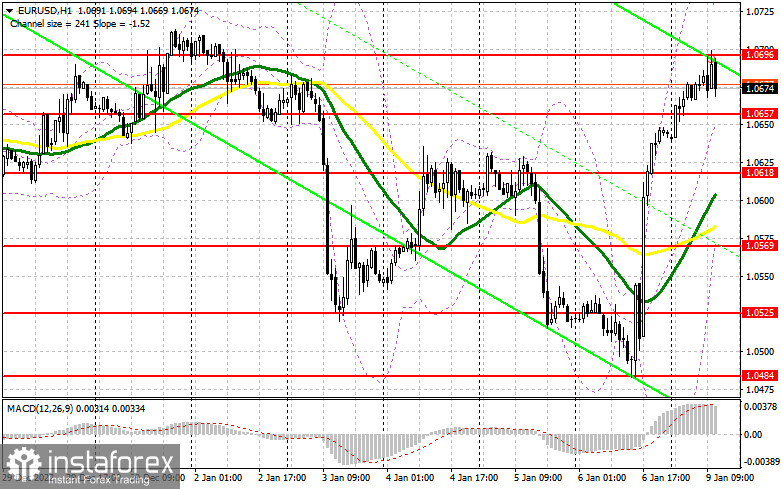
In the US session, no significant data is expected, and updates on the consumer credit index and the US labor market trends index are unlikely to be of any interest to traders at all. As a result, sellers will have a decent opportunity to construct a downward correction to the support level of 1.0657. The bulls will only be able to return to the day's high of 1.0696, above which they were unable to exit during the first half of the day, if there is a downturn and the development of a false breakdown at this level. An additional entry point for establishing long positions with a move up to a maximum of 1.0733 is formed by a breakout and top-down test of this range, which signifies the beginning of a new bullish trend. If this level is broken, stop orders will be hit and a new signal will be formed, with a potential breakthrough to 1.0772, where I advise fixing profits. The pressure on the pair will dramatically grow if EUR/USD drops and there are no buyers above 1.0657 in the afternoon. Therefore, the next support level around 1.0618 will be the focus. Only the occurrence of a false collapse will provide a signal to buy the euro against the trend. Opening long positions right away for a rebound from the moving averages' lowest of 1.0569 or even lower, around 1.0525, with the goal of an upward corrective of 30-35 points within a day, is possible.
You need the following to open short positions on EURUSD:
Since economists' predictions for the eurozone's unemployment rate came true, sellers took advantage of the fact that euro buyers had nothing to hold onto during the first half of the day. Maintaining control above 1.0696 is now crucial, and the likelihood of a greater downward correction will persist as long as trading is done below this level. If the EUR/USD rises once more during the American session, the best-selling scenario will be a series of poor consolidations above 1.0696 that will signal the opening of short positions and a move to 1.0657, as I previously discussed. It will be fascinating to see how this range breaks down and is reversal tested because it could substantially impair short-term bullish prospects, put more pressure on the euro, and create a second sell signal with an exit to 1.0618, where the bears would undoubtedly retreat. If the market consolidates below this band, it will move more significantly down to the area of 1.0569, which will bring back the bear market. The region around 1.0525 will be the farthest target, and that's where I suggest fixing profits. If the EUR/USD rises during the American session and there are no bears around 1.0696 and everything is pointing in this direction, I suggest delaying opening short positions until 1.0733. Additionally, you can only sell there following a failed consolidation. For a rebound from the high point of 1.0772 and a downward correction of 30-35 points, I advise selling EUR/USD right away.

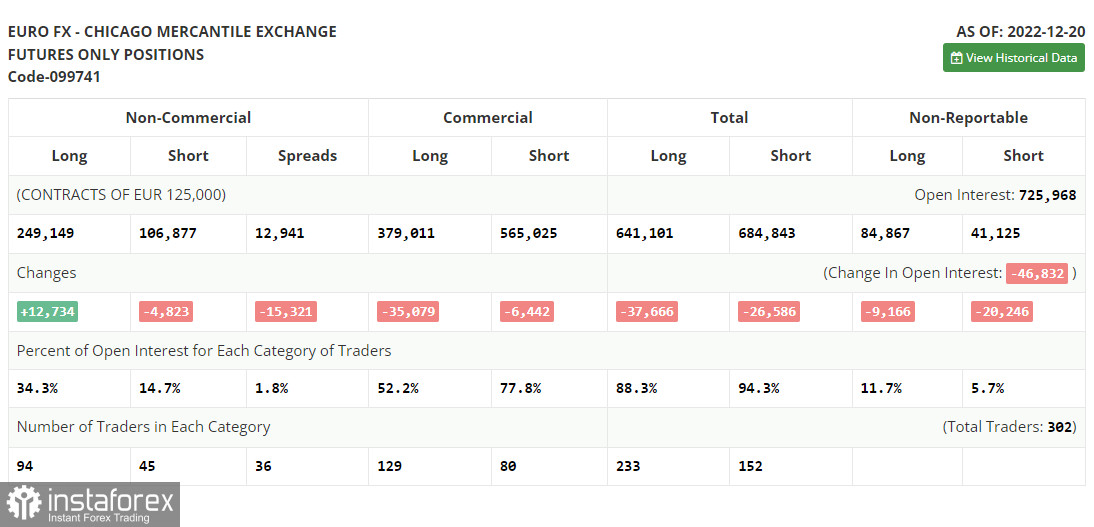
The increase in long positions and the decline in short ones were noted in the COT report (Commitment of Traders) for December 20. The central bank meetings at the end of the year and the favorable figures on the eurozone and Germany that were released last week prompted traders to raise their purchases of the euro. The power dynamic was not materially altered by this, and we are still trading inside the channel we established last week. The US dollar continues to be in demand as traders anticipate additional tightening of monetary policy due to the dangers of maintaining inflationary pressure at a high-level next year. Strong data on US GDP growth in the third quarter of this year and the labor market further support this expectation. It is doubtful that you will have a strong urge to purchase risky assets once the recession is added to the list. According to the COT data, the number of long non-commercial positions rose by 12,734 to 249,149, while the number of short non-commercial positions decreased by 4,823 to 106,877. The entire non-commercial net position climbed significantly for the week, rising from 122,247 to 142,279 in value. This shows that despite their concerns, investors are still buying euros in anticipation of the ECB raising interest rates more dramatically in 2019. But a new fundamental justification is required for the euro to continue its upward growth. In contrast to 1.0342, the weekly ending price increased to 1.0690.

Signals from indicators
Moving Averages
The fact that trading is taking place above the 30 and 50-day moving averages suggests that buyers are in the lead.
Note that the author's consideration of the period and cost of moving averages on the hourly chart H1 differs from the standard definition of the traditional daily moving averages on the daily chart D1.
Bands by Bollinger
The indicator's upper bound in the vicinity of 1.0696 will serve as resistance in the event of expansion.
Description of indicators
- Moving average (moving average determines the current trend by smoothing out volatility and noise). Period 50. The graph is marked in yellow.
- Moving average (moving average determines the current trend by smoothing out volatility and noise). Period 30. The graph is marked in green.
- MACD indicator (Moving Average Convergence / Divergence - moving average convergence/divergence) Fast EMA period 12. Slow EMA period 26. SMA period 9
- Bollinger Bands (Bollinger Bands). Period 20
- Non-profit speculative traders, such as individual traders, hedge funds, and large institutions use the futures market for speculative purposes and to meet certain requirements.
- Long non-commercial positions represent the total long open position of non-commercial traders.
- Short non-commercial positions represent the total short open position of non-commercial traders.
- Total non-commercial net position is the difference between the short and long positions of non-commercial traders.
 English
 Русский
 Bahasa Indonesia
 Bahasa Malay
 ไทย
ไทย Español
 Deutsch
 Български
 Français
 Tiếng Việt
 中文
中文 বাংলা
বাংলা हिन्दी
 Čeština
 Українська
 Română

