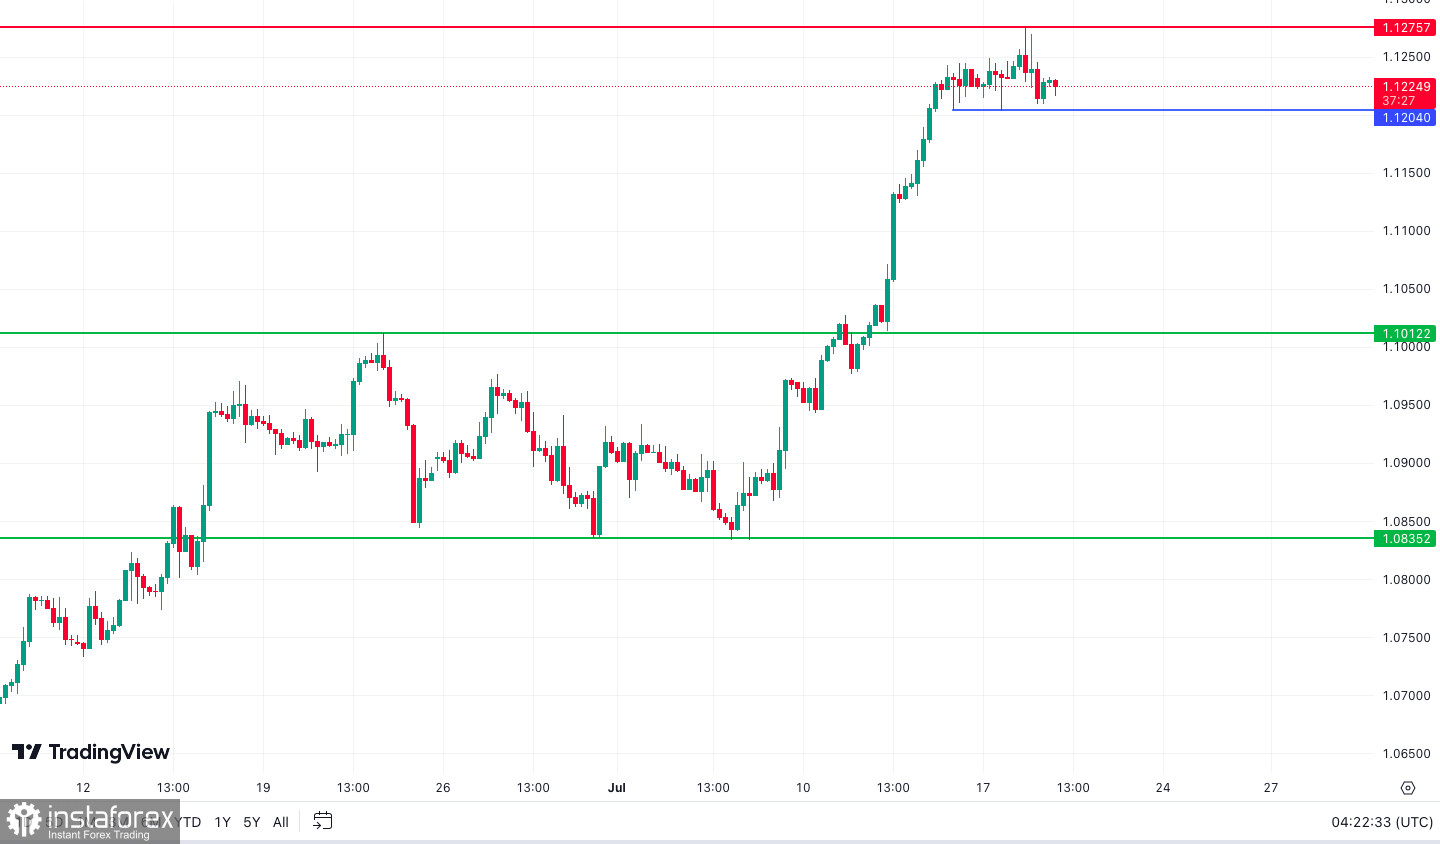
Technical Market Outlook:
The EUR/USD pair has made another swing high at the level of 1.1261 and is approaching the next target for bulls seen at the level of 1.1286, which is the 61% Fibonacci retracement level of the big wave down on the Weekly time frame chart. The momentum is coming off the extremely overbought conditions, so the market might pull-back lower any time now. The intraday technical support is seen at the level of 1.1205, but in a case of a breakout lower, the next target for bears is seen at the level of 1.1020 and 1.1010. Only a sustained breakout below the moving average dynamic support around 1.0900 would change the outlook to more negative.

Weekly Pivot Points:
WR3 - 1.12534
WR2 - 1.12384
WR1 - 1.12326
Weekly Pivot - 1.12234
WS1 - 1.12176
WS2 - 1.12084
WS3 - 1.11934
Trading Outlook:
Since the beginning of October 2022 the EUR/USD is in the corrective cycle to the upside, but the main, long-term trend remains bearish. This corrective cycle might be terminated at the level of 1.1286 which is 61% Fibonacci retracement level when it is hit, so please keep an eye on this level and the way the market participants (bulls and bears) will deal with it.
 English
 Русский
 Bahasa Indonesia
 Bahasa Malay
 ไทย
ไทย Español
 Deutsch
 Български
 Français
 Tiếng Việt
 中文
中文 বাংলা
বাংলা हिन्दी
 Čeština
 Українська
 Română

