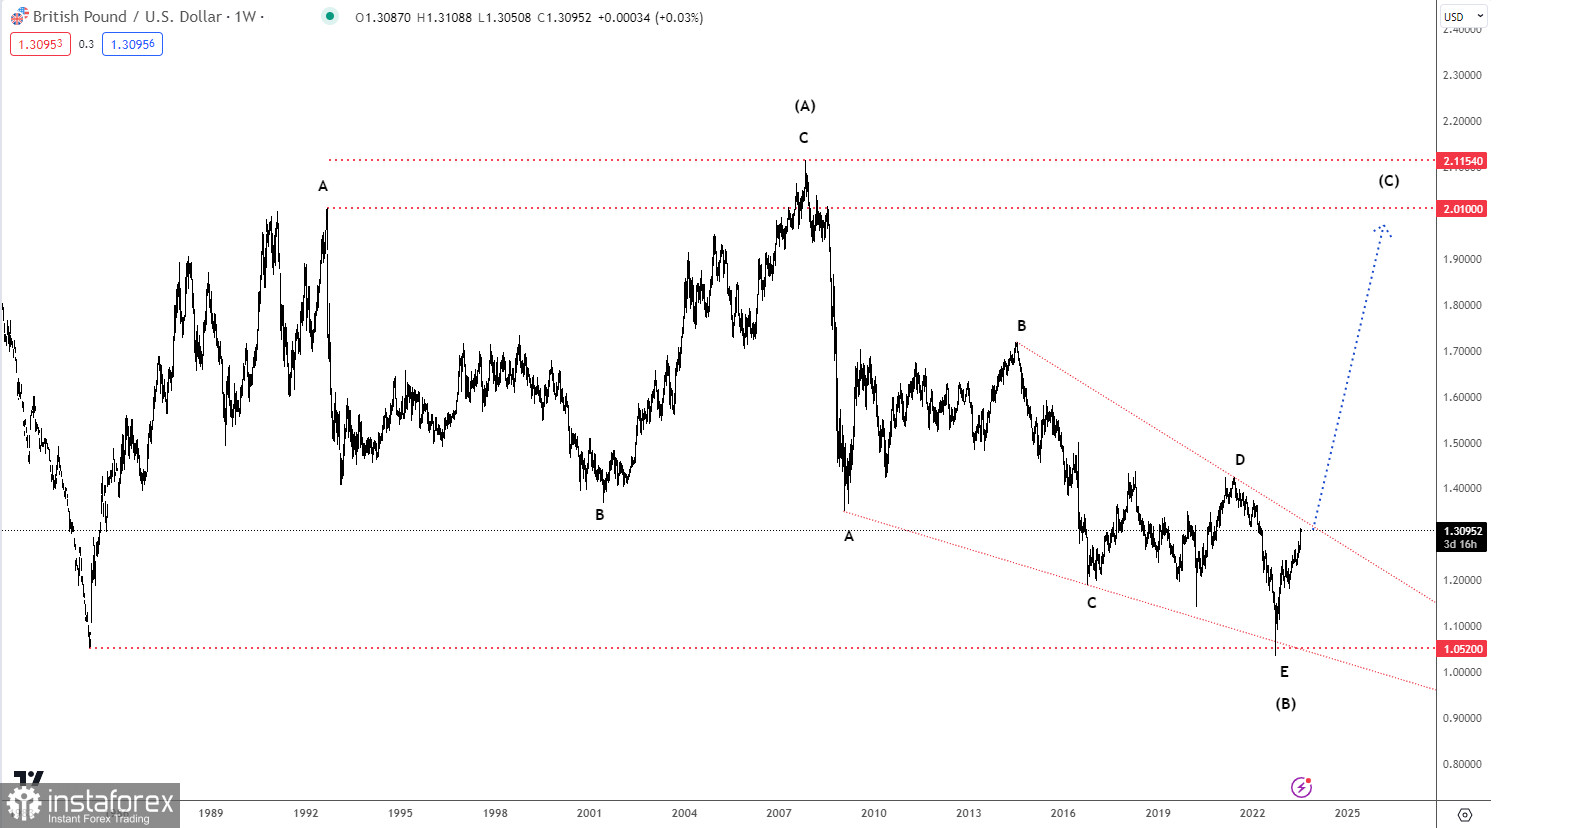
Today we will look at the long-term wave count for GBP/USD or the Cable as it's called within the currency trading world. Going back to 1985, we can see the Cable bottoming at 1.0520 and that low was revisited in September 2022 from where a strong impulsive rally developed. The decline that was seen up to the low of September 2022 started from the 2007 high at 2.0896 and was followed by a wedge-shaped decline to the low of 1.0357 in September 2022. The ongoing wave (C) should ultimately break above the wedge resistance line near 1.3350 for a rally towards the resistance area between 2.0100 - 2.1150 to complete the consolidation since 1985.
A possible time indication for the rally into the 2.0100 - 2.1150 area is something in the area of 7 years or in the year 2029.
 English
 Русский
 Bahasa Indonesia
 Bahasa Malay
 ไทย
ไทย Español
 Deutsch
 Български
 Français
 Tiếng Việt
 中文
中文 বাংলা
বাংলা हिन्दी
 Čeština
 Українська
 Română

