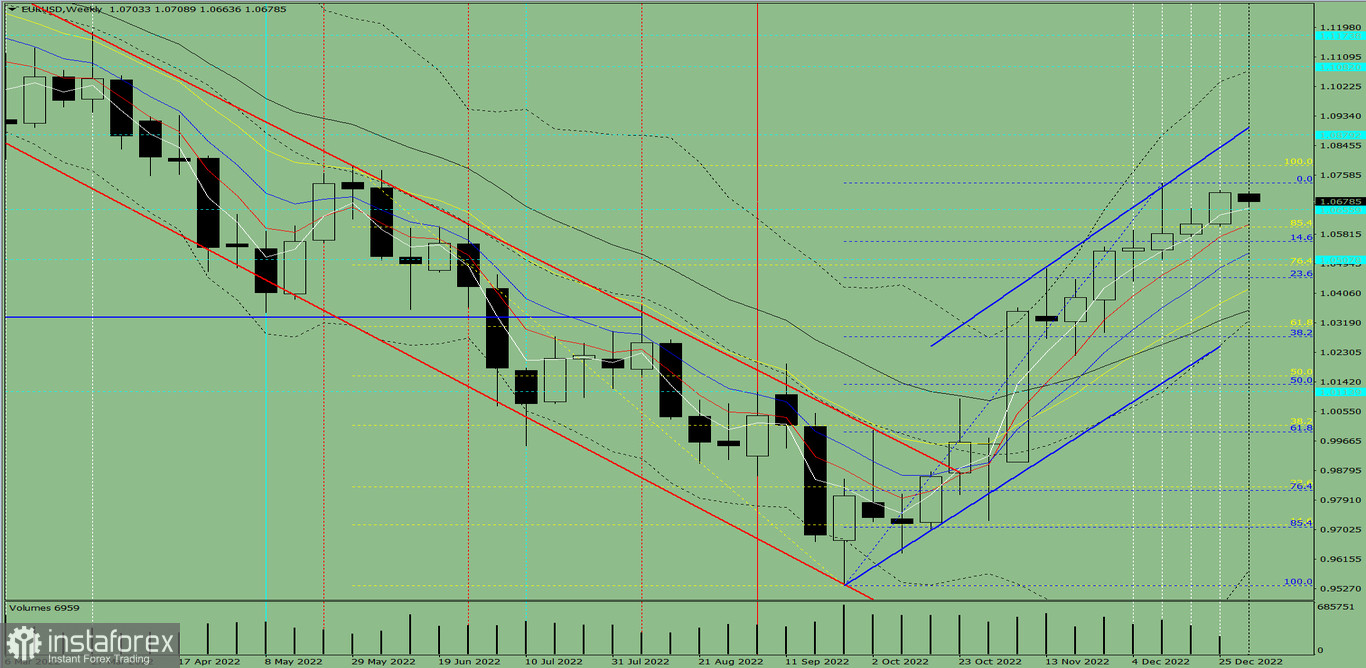
Trend analysis
The market may begin heading lower this week from the level of 1.0706 (the close of the previous weekly candle), with a goal of 1.0560 and a retreat level of 14.6%. After achieving this level, keep moving forward.

Fig. 1 (weekly chart)
A comprehensive analysis
- Indicator analysis – down;
- Fibonacci levels – down;
- Volumes – down;
- Candle analysis – down;
- Trend analysis – down;
- Bollinger lines – up;
- Monthly chart - down.
The sophisticated analysis has an upward movement as its conclusion.
The first lower shadow of the weekly white candle (Monday - down) and the presence of the second upper shadow indicate that the price during the week is likely to have an upward trend. This is the overall result of calculating the candle of the EUR/USD currency pair according to the weekly chart.
The market may begin heading lower this week from the level of 1.0706 (the close of the previous weekly candle), with a target price of 1.0560 - a 14.6% decline level. After achieving this level, keep moving forward.
Alternatively, the pair might begin to decline from the level of 1.0706 (close of the most recent weekly candle), with the historical support level of 1.0656 being the eventual destination. The price may climb higher from here to test the upper fractal, or 1.0786. After achieving this level, keep moving forward.
 English
 Русский
 Bahasa Indonesia
 Bahasa Malay
 ไทย
ไทย Español
 Deutsch
 Български
 Français
 Tiếng Việt
 中文
中文 বাংলা
বাংলা हिन्दी
 Čeština
 Українська
 Română

