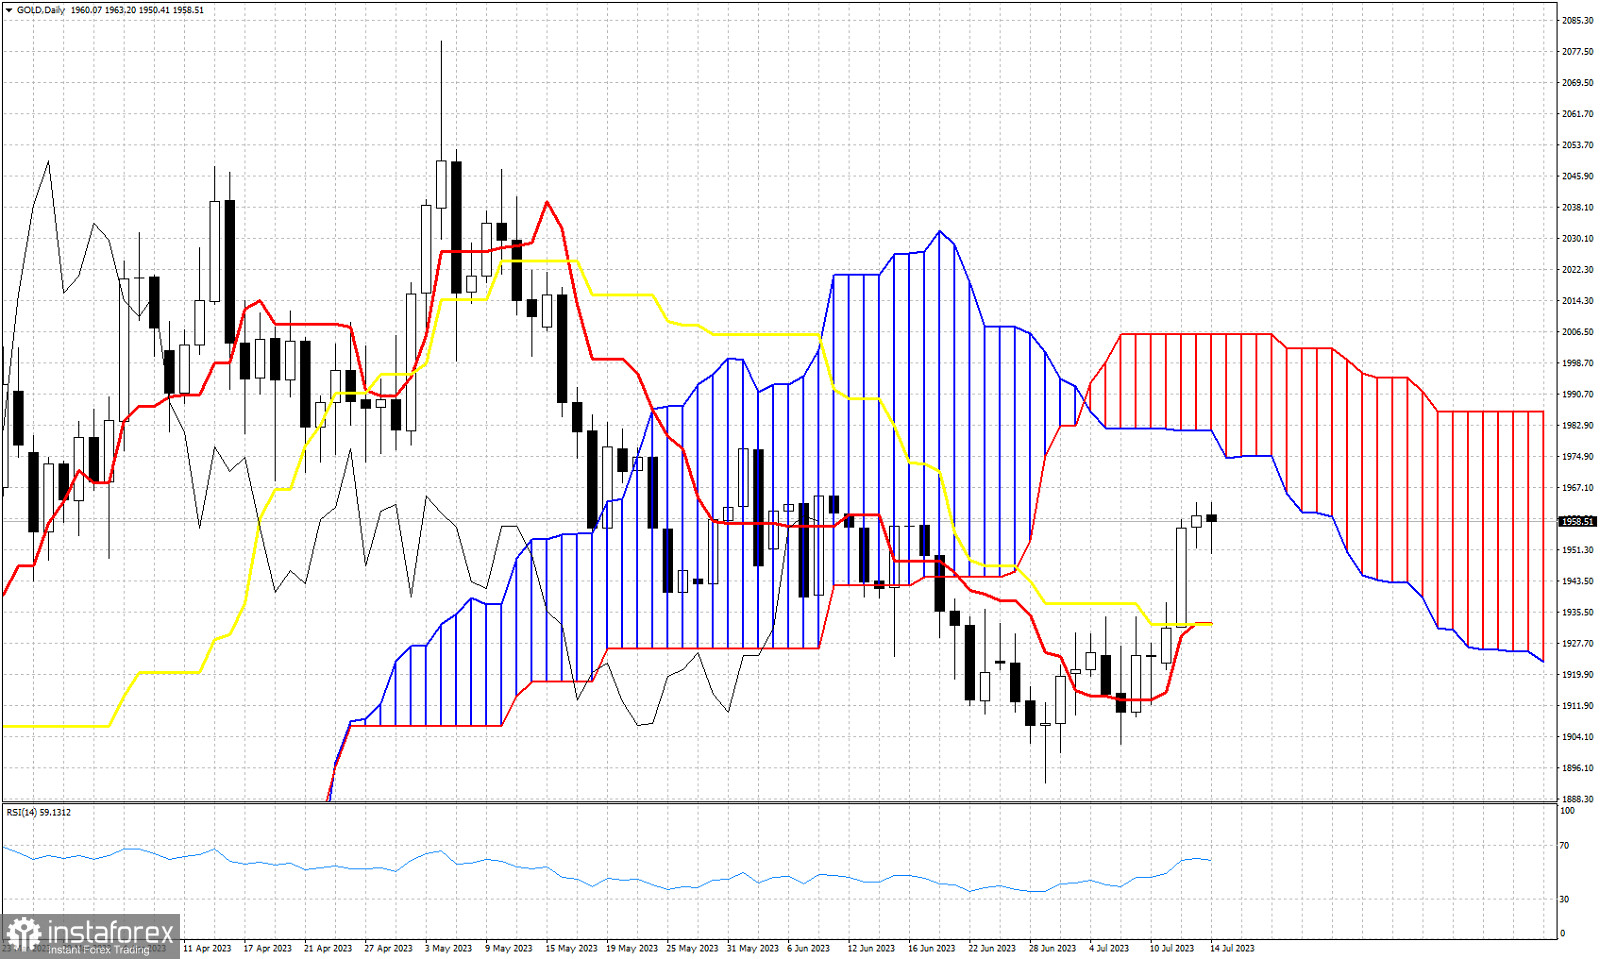
Gold price is trading around $1,960 which was our short-term technical target after the recent bullish signals. According to the Ichimoku cloud indicator in the Daily chart, trend remains bearish despite the recent bounce as price remains below the Kumo (cloud). For the Ichimoku cloud indicator this is still considered a bounce in the Daily chart. Key resistance is at the lower cloud boundary at $1,981. In the 4 hour chart according to the Ichimoku cloud indicator trend is bullish as price is above the Kumo. This increases the chances we see a test of the $1,980 level and the Daily Kumo over the coming trading sessions. Support is found at $1,932 where we find both the tenkan-sen (red line indicator) and the kijun-sen (yellow line indicator). The tenkan-sen is also very close to crossing above the kijun-sen providing a bullish sign. The Chikou span (black line indicator) is challenging the candlestick pattern but remains below it (bearish). We need to see price break above $1,970 in order for the Chikou span to turn bullish. Bulls have a lot of work ahead in order to change daily trend to bullish. But we know the key levels that they need to recapture for this to happen.
 English
 Русский
 Bahasa Indonesia
 Bahasa Malay
 ไทย
ไทย Español
 Deutsch
 Български
 Français
 Tiếng Việt
 中文
中文 বাংলা
বাংলা हिन्दी
 Čeština
 Українська
 Română

