 English
  Русский
 Bahasa Indonesia
 Bahasa Malay
 ไทย
ไทย Español
 Deutsch
 Български
 Français
 Tiếng Việt
 中文
中文 বাংলা
বাংলা हिन्दी
 Čeština
 Українська
 Română

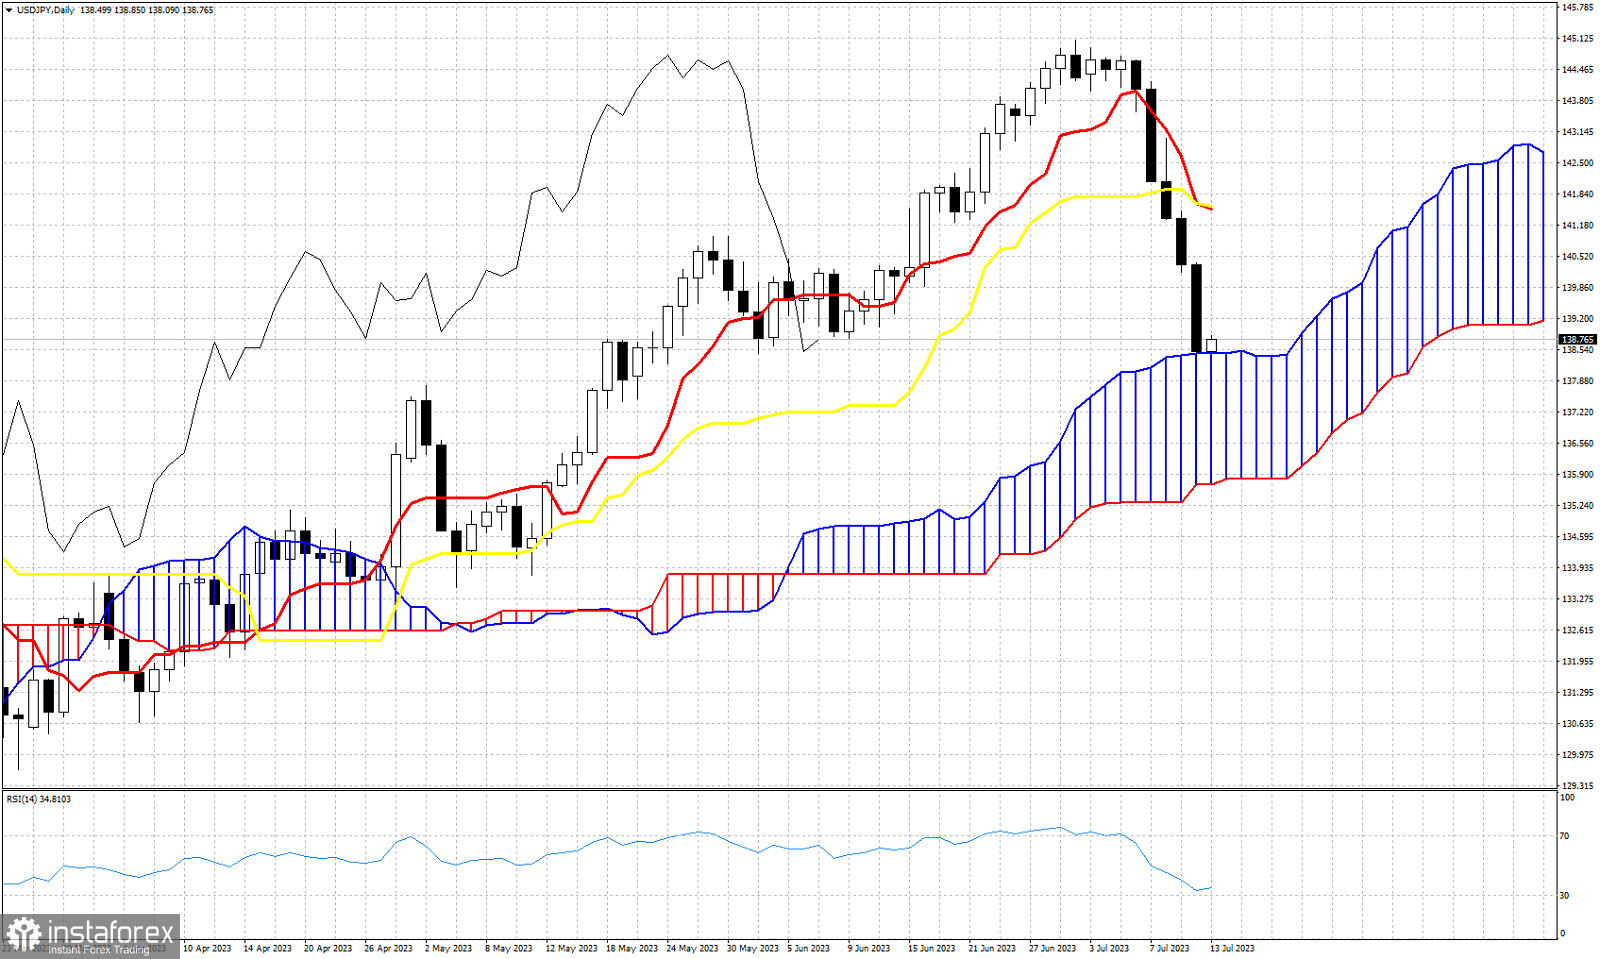
The tenkan-sen (red line indicator) has crossed the kijun-sen (yellow line indicator). This is a sign of weakness. The both provide short-term resistance around 141.58. The Chikou span (black line indicator) has crossed below the candlestick pattern (bearish). This is another sign of weakness. However in order for trend to change, we must see price inside the Kumo (cloud). Price remains vulnerable to more downside, however in the near term if recent low at 138.07 holds, we could see price bounce towards the 141.50 area.