 English
  Русский
 Bahasa Indonesia
 Bahasa Malay
 ไทย
ไทย Español
 Deutsch
 Български
 Français
 Tiếng Việt
 中文
中文 বাংলা
বাংলা हिन्दी
 Čeština
 Українська
 Română

Trend analysis (Fig. 1)
EUR/USD will attempt to move up from the closing of yesterday's daily candle at 1.0611 to the resistance level of 1.0656 (thick white line) and to the upper fractal at 1.0736 (blue dotted line).
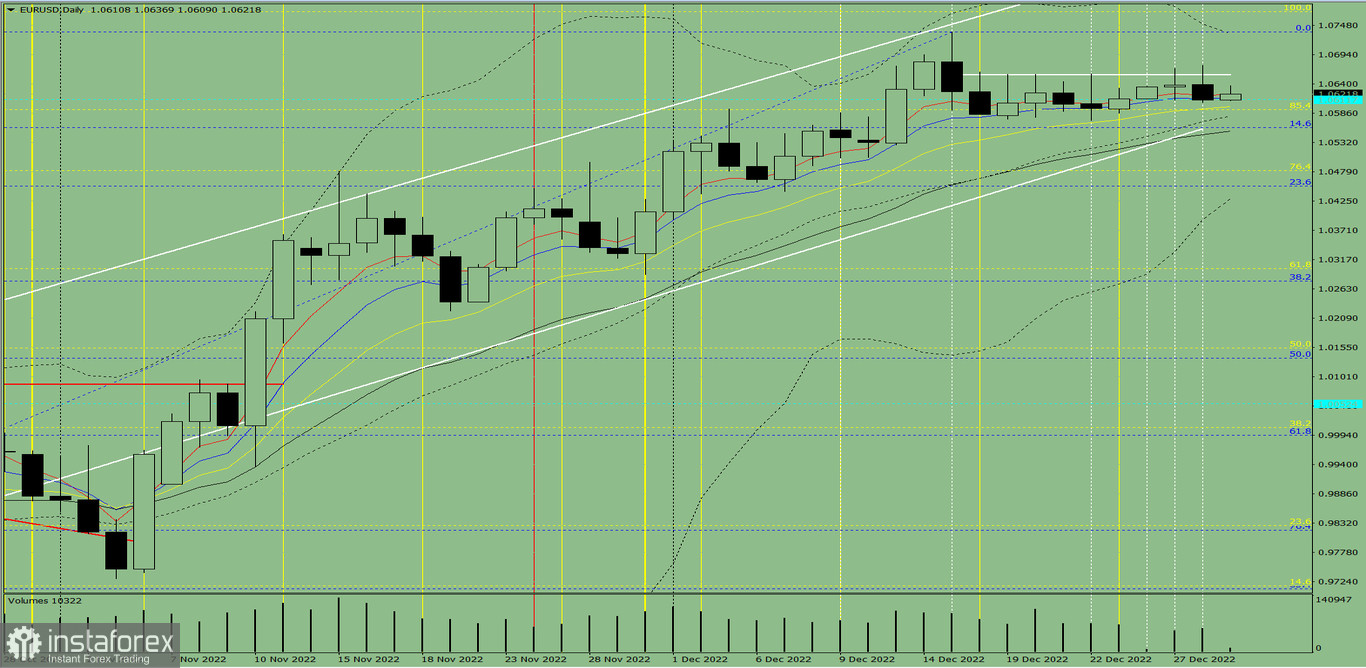
Fig. 1 (daily chart)
Comprehensive analysis:
Indicator analysis - downtrend
Fibonacci levels - downtrend
Volumes - uptrend
Candlestick analysis - uptrend
Trend analysis - uptrend
Bollinger bands - uptrend
Weekly chart - uptrend
Conclusion: EUR/USD will rise from 1.0611 (closing of yesterday's daily candle) to the resistance level of 1.0656 (thick white line) and to the upper fractal at 1.0736 (blue dotted line).
Alternatively, the pair could climb from 1.0611 (closing of yesterday's daily candle) to the resistance level of 1.0656 (thick white line), then pull back to the 14.6% retracement level at 1.0561 (blue dotted line).