 English
  Русский
 Bahasa Indonesia
 Bahasa Malay
 ไทย
ไทย Español
 Deutsch
 Български
 Français
 Tiếng Việt
 中文
中文 বাংলা
বাংলা हिन्दी
 Čeština
 Українська
 Română

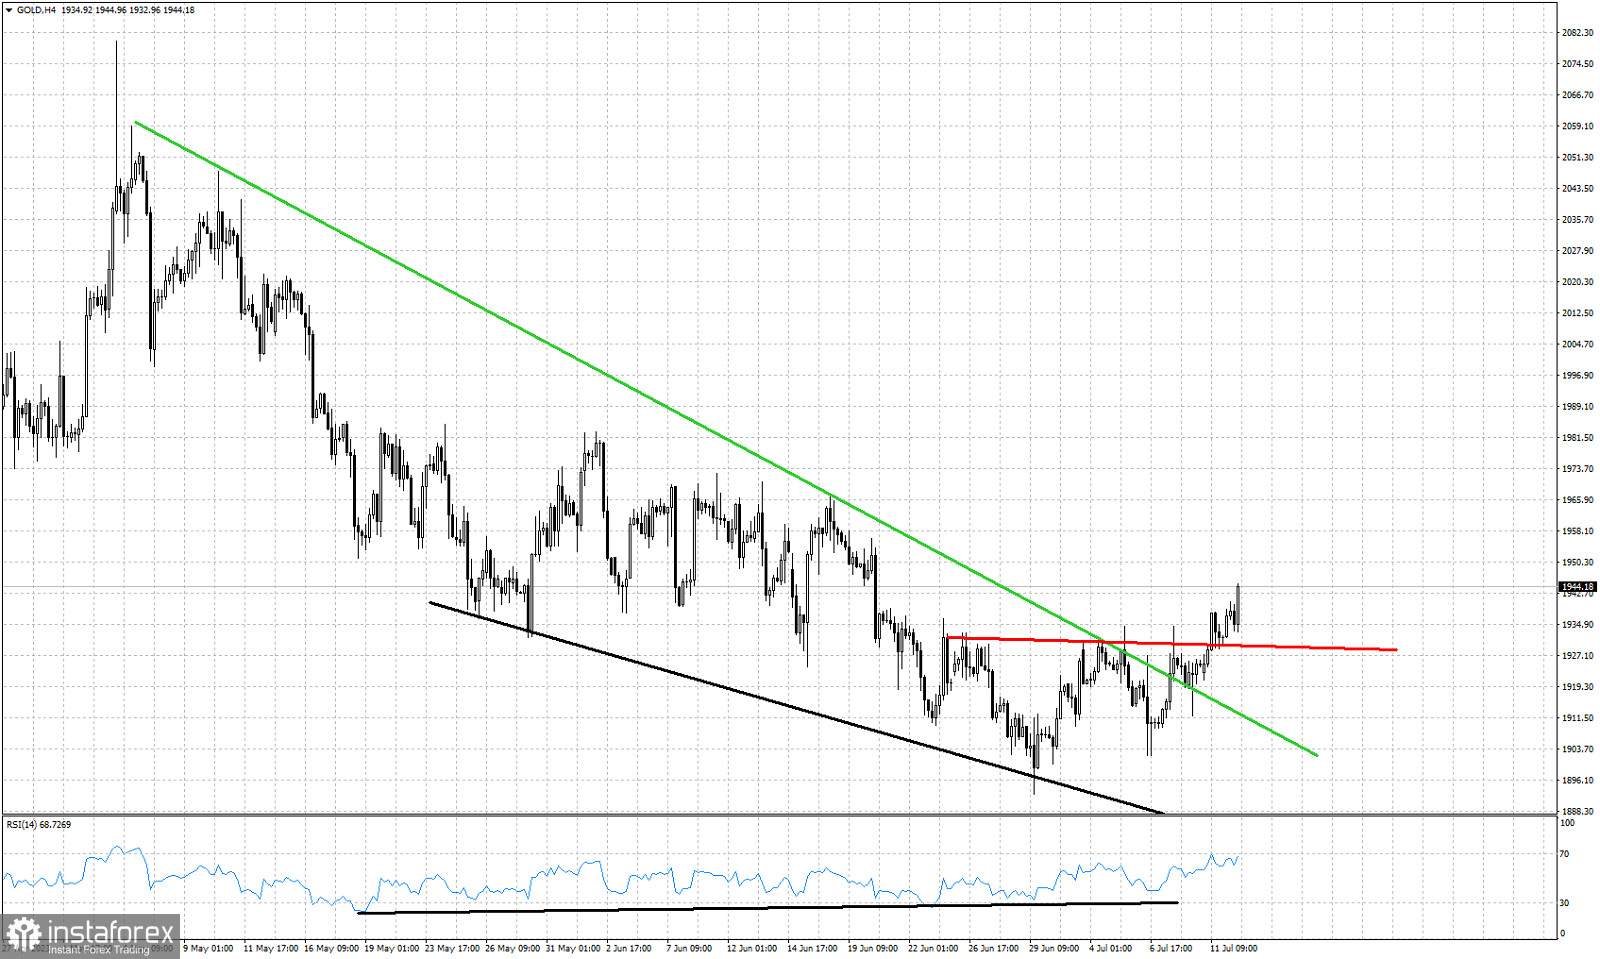
Green line- resistance (broken)
Red line- resistance (broken)
Black line- bullish divergence
Gold price is trading around $1,940 and has clearly broken also above the red resistance trend line. The first bullish signal came when price broke above the green trend line resistance. Combined with the bullish RSI divergence we warned traders of the increased chances of a reversal. Gold is in a bullish short-term trend making higher highs and higher lows. First upside target is at $1,960-65 where we find the 38% Fibonacci retracement of the entire decline. Support is at $1,930 which was once resistance. Bulls do not want to see price lose what it recently gained.