 English
  Русский
 Bahasa Indonesia
 Bahasa Malay
 ไทย
ไทย Español
 Deutsch
 Български
 Français
 Tiếng Việt
 中文
中文 বাংলা
বাংলা हिन्दी
 Čeština
 Українська
 Română

Overview :
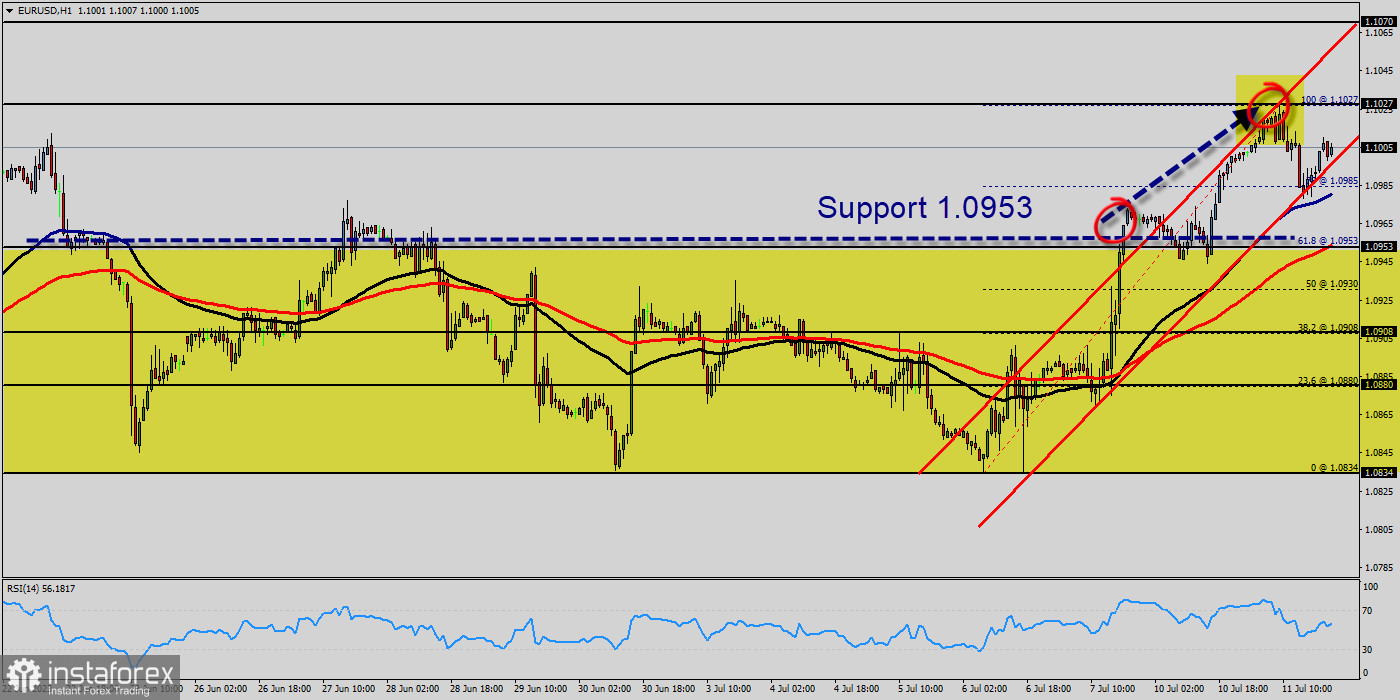
The EUR/USD pair found support at the level of 1.0953 and rose back above 1.0953 in a choppy session. The US Dollar lost momentum, resulting in the pair's rebound. Market participants positioned themselves ahead of the release of the US CPI data scheduled to be published on Tuesday.
The EUR/USD pair formed a strong follow-through bar yesterday after last Friday's strong bull close.The market exceeded the July 11 high early this morning and reversed down. The bulls see the recent three consecutive bull bars as being strong enough for a second leg and a test of the July high.
The EUR/USD pair currently trades in the 1.0953 price zone, and the daily chart shows that it turned red. Nevertheless, the pair continues to develop above all its moving averages, with the 50 Simple Moving Average (SMA) providing dynamic support at 1.0953 while advancing above the longer ones.
At the same time, technical indicators have lost their bullish strength. The Momentum indicator turned south and hovers around its 100 level, while the Relative Strength Index (RSI) indicator consolidates at around 60, the latter limiting the chances of a steeper decline. Further close above the high end may cause a rally towards 1.1027.
In the near term, the decline seems corrective. The one-hour chart shows technical indicators retreat from overbought territory, heading firmly lower, although well into positive ground. Meanwhile, a bullish 50 SMA accelerated north and crossed above a flat 100 SMA well below the current level, in line with the dominant bullish trend.
The EUR/USD pair hit the weekly pivot point and resistance 1, because of the series of relatively equal highs and equal lows. But, the pair has dropped down in order to bottom at the point of 1.0985. Hence, the major support was already set at the level of 1.0953.
Moreover, the double bottom is also coinciding with the major support this week. Additionally, the RSI is still calling for a strong bullish market as well as the current price is also above the moving average 100. Therefore, it will be advantageous to buy above the support area of 1.0953 with the first target at 1.1027.
From this point, if the pair closes above the weekly double top of 1.1027, the EUR/USD pair may resume it movement to 1.1070 to test the weekly resistance 1. Nonetheless, the weekly resistance level and zone should be considered.
At the moment, today's bar is a bear bar on its low. Even if the bears can get a bear bar closing in it low, there are probably buyers below scaling in lower. This means the downside over the next few days is probably limited. The stop loss should always be taken into account, accordingly, it will be of beneficial to set the stop loss below the last bottom at 1.0908.