 English
  Русский
 Bahasa Indonesia
 Bahasa Malay
 ไทย
ไทย Español
 Deutsch
 Български
 Français
 Tiếng Việt
 中文
中文 বাংলা
বাংলা हिन्दी
 Čeština
 Українська
 Română

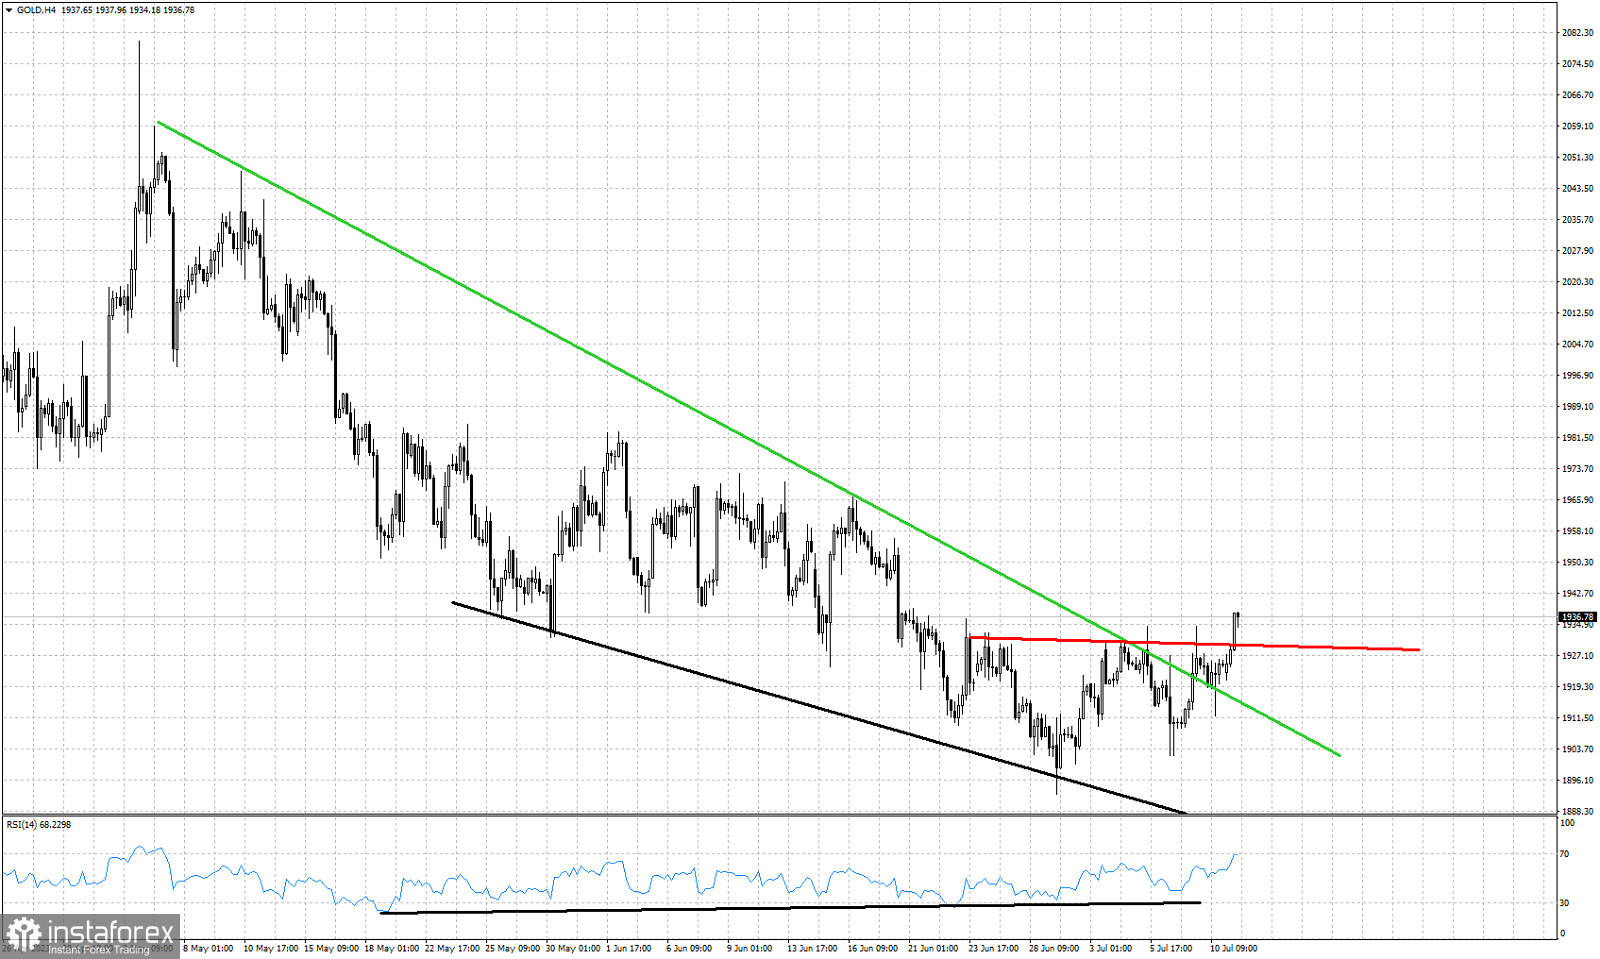
Black lines- bullish divergence
Green line -resistance
Red line - resistance
Gold price is trading again above $1,930. Gold price has already broken above the green downward sloping resistance trend line and is now breaking above the red horizontal resistance trend line. Price action gives us a second bullish sign with price starting to form higher highs and higher lows. Gold has upside potential towards $1,960 if price remains above the $1,930 area. This could be the start of a new up trend wave. Bulls are getting stronger and getting the upper hand as well.