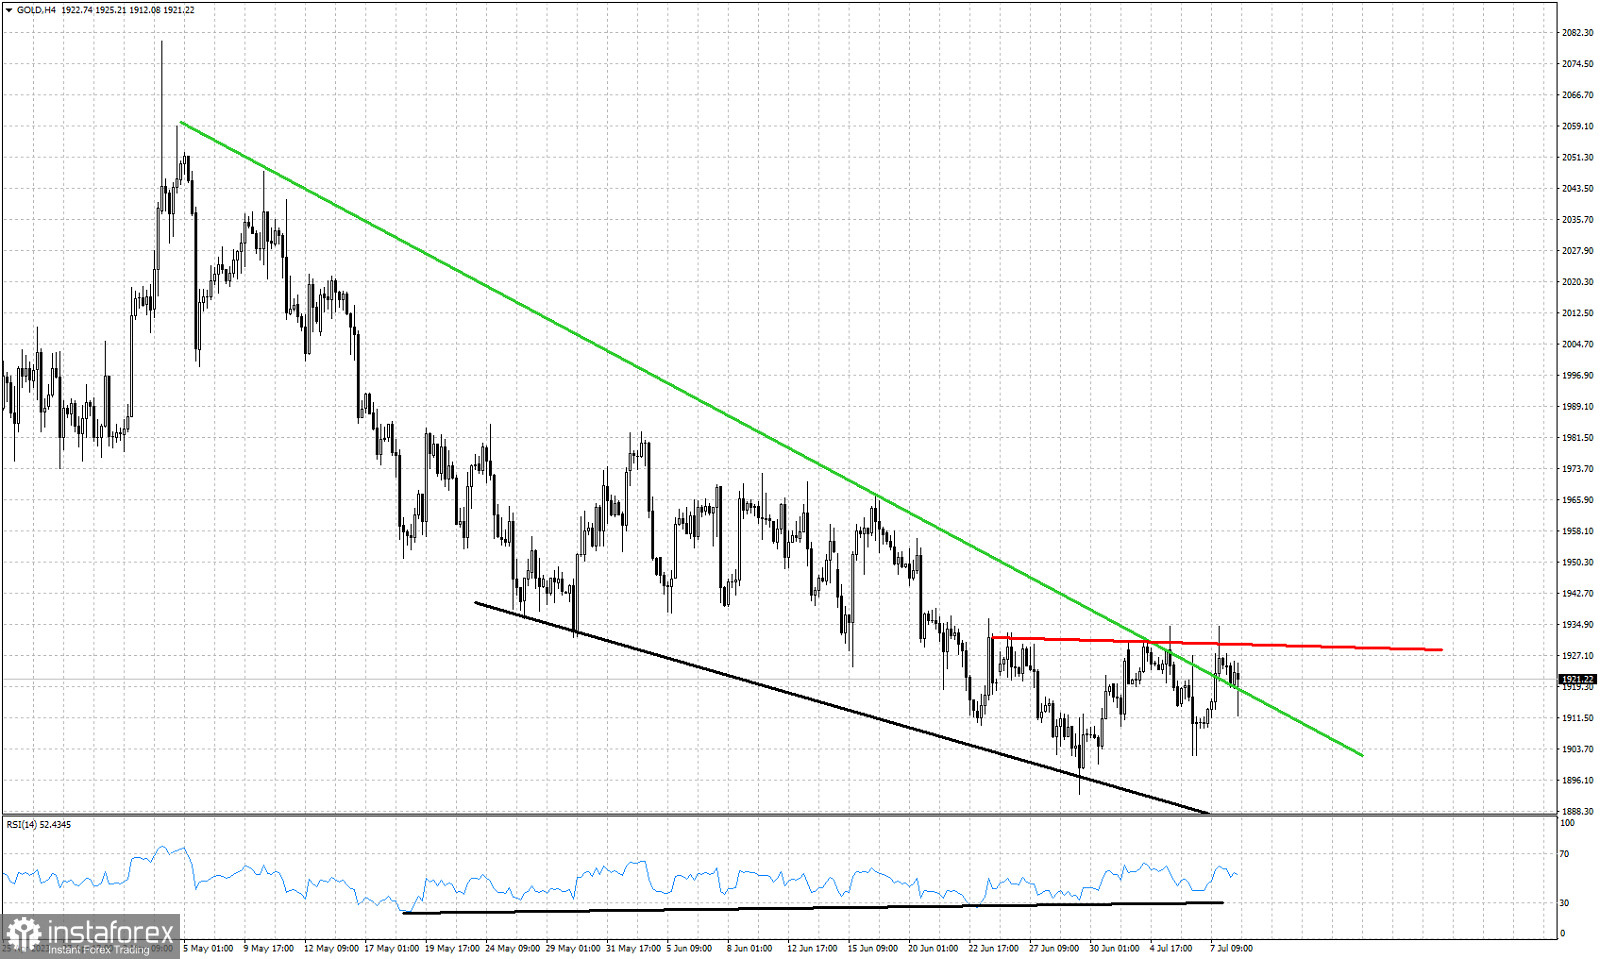
Green line- resistance (broken)
Red line- horizontal resistance
Black lines- RSI bullish divergence
Gold price is trading around $1,922. Gold price has broken above the short-term downward sloping resistance trend line providing a possible reversal signal. Price has stopped at $1,934 with bulls unable to close above $1,930. For the continuation of this upward move, bulls need to recapture $1,930 and stay above it. The bullish RSI divergencies suggest that a reversal is very close. Price has started making higher lows and the break of the green trend line was a first step towards the trend reversal. Bulls need to push price above the red resistance in order to strengthen the bullish momentum.
 English
 Русский
 Bahasa Indonesia
 Bahasa Malay
 ไทย
ไทย Español
 Deutsch
 Български
 Français
 Tiếng Việt
 中文
中文 বাংলা
বাংলা हिन्दी
 Čeština
 Українська
 Română

