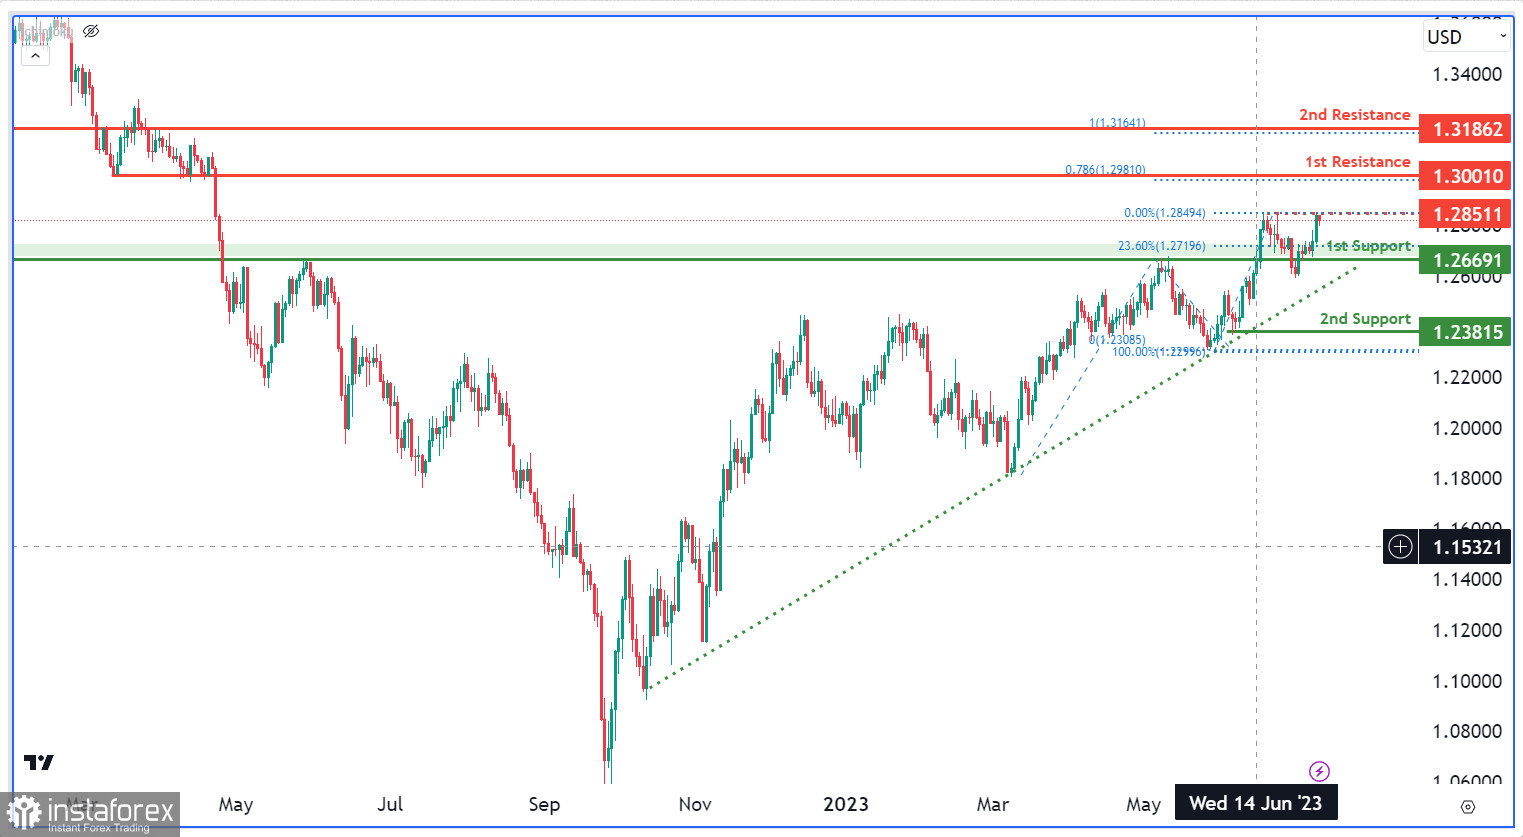
The GBP/USD chart currently exhibits a weak bullish momentum. There is a potential for a bullish continuation in the market towards the first resistance at 1.3001 which is an overlap resistance that aligns with a 78.60% Fibonacci Projection level. The second resistance level at 1.3186 is identified as an overlap resistance and coincides with a 100% Fibonacci Projection.
The first support level at 1.2669 is an overlap support that aligns with a 23.60% Fibonacci Retracement, while the second support level at 1.2382 is identified as a multi-swing-low support.
 English
 Русский
 Bahasa Indonesia
 Bahasa Malay
 ไทย
ไทย Español
 Deutsch
 Български
 Français
 Tiếng Việt
 中文
中文 বাংলা
বাংলা हिन्दी
 Čeština
 Українська
 Română

