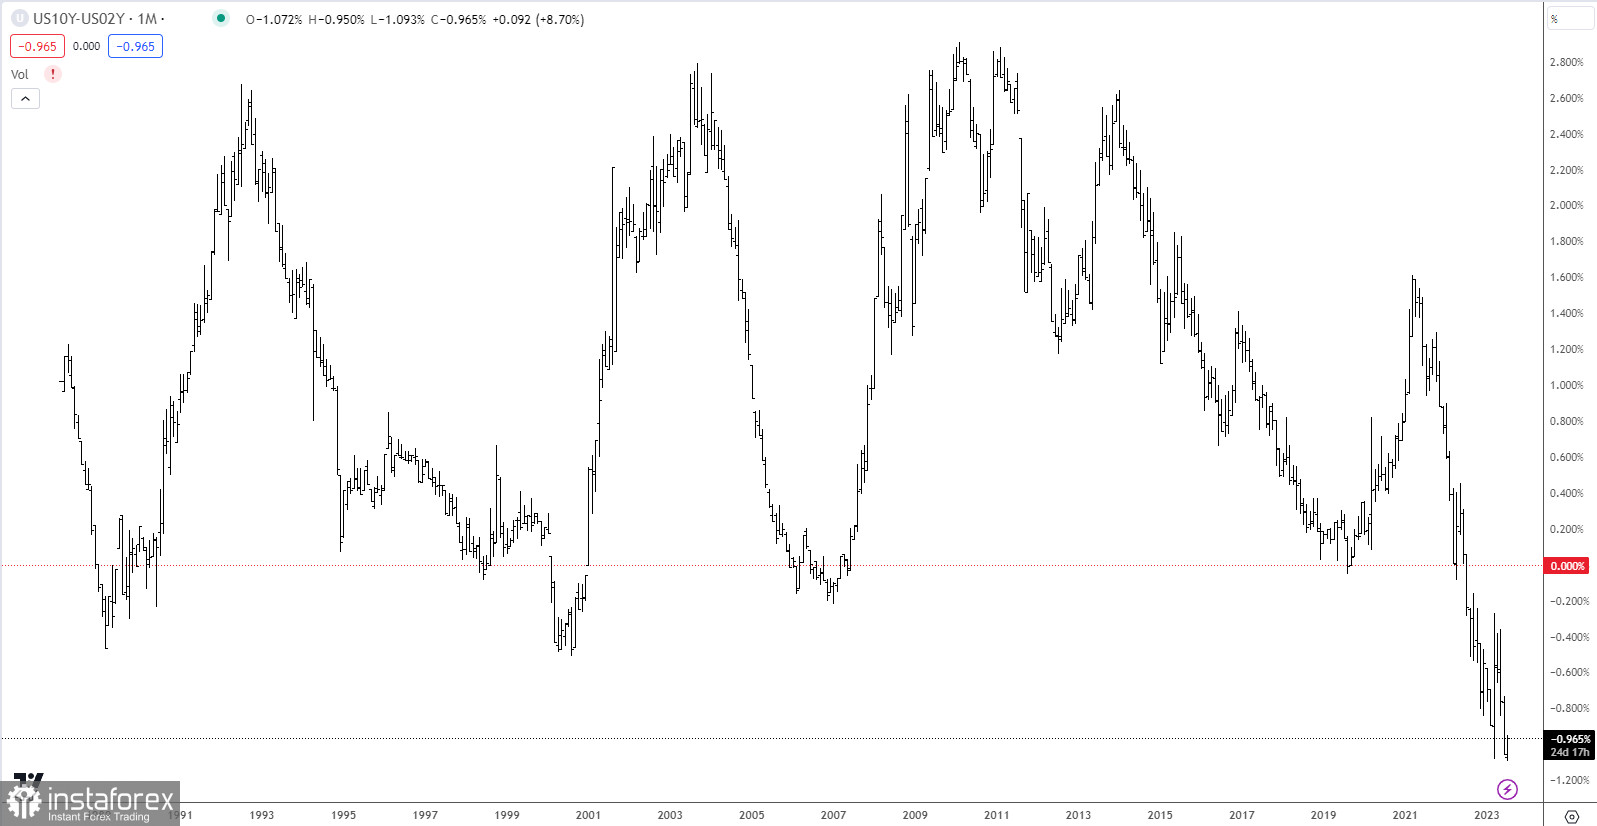
One of the best indicators for a coming recession is when the yield curve between the 10-year and the 2-year US Treasury yields inverts. Subtracting the 2-year yield from the 10-year yield should stay well above 0, but when the economy is heading towards hard times, we see an inversion and the curve dropping below 0. Looking at the chart above, we can see the largest inversion since the late 1980's indicating that a recession is stirring us in the eyes. This indicator is not a timing tool, but it has been a very reliable barometer for recession periods and we don't see anything on the horizon that could avert a recession coming.
Recessions are never good for the equity markets and we should be prepared that the coming months/years will not bring the best of times for the equity markets and the economy.
 English
 Русский
 Bahasa Indonesia
 Bahasa Malay
 ไทย
ไทย Español
 Deutsch
 Български
 Français
 Tiếng Việt
 中文
中文 বাংলা
বাংলা हिन्दी
 Čeština
 Українська
 Română

