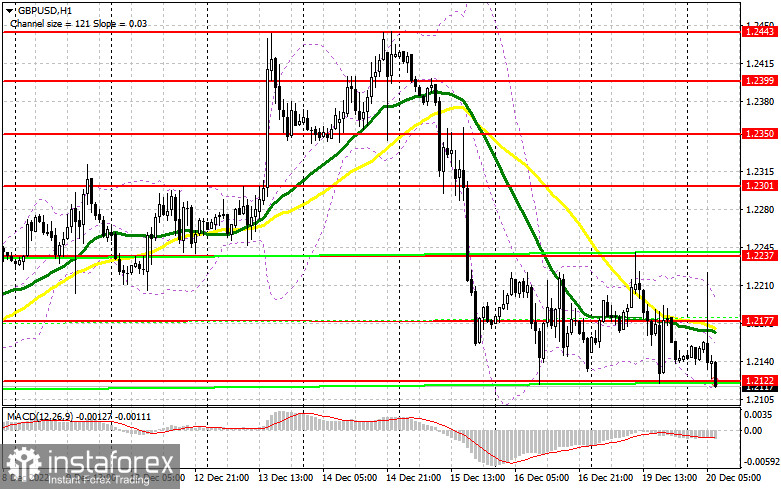
Yesterday, traders received several good signals to enter the market. Let us focus on the 5-minute chart to figure out what happened. Earlier, I asked you to pay attention to the level of 1.2197 to decide when to enter the market. A breakout and a downward test of 1.2197 led to a perfect buy signal, which allowed the pair to rise by more than 40 pips. Unfortunately, the pair failed to reach 1.2249. That is why sellers did not get an entry point. In the second part of the day, after a slump in the pound sterling, we saw a false breakout of 1.2122, which led to a buy signal and a rise of more than 60 pips.

Conditions for opening long positions on GBP/USD:
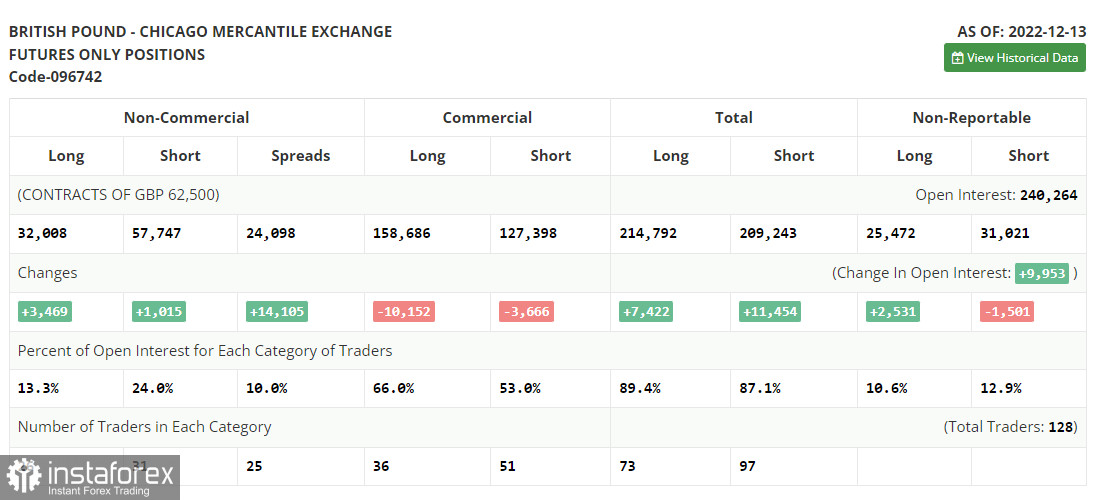
Before we analyze the movement of the pound sterling let us take a look at the futures market. According to the COT report from December 13, the number of both long and short positions jumped. Since the number of long positions exceeded the number of the short ones, we can say that there are a lot of traders who are ready to buy the asset at the current high prices. The currency gained in value amid the BoE's decision to remain stuck to its aggressive approach to combat surging inflation. Notably, inflation showed an insignificant decline last month. However, such a monetary policy makes economists expect a recession in the UK, which is capping the upward potential of the British pound. That is why traders should be cautious when opening buy orders on the asset. It is better to wait for a downward correction, which is expected to be quite noticeable. According to the COT report, the number of short non-commercial positions increased by 1,015 to 57,747, while the number of long non-commercial positions surged by 3,469 to 32,008. This led to a reduction in the negative value of the non-commercial net position to -25,739 against -28,193 a week earlier. The weekly closing price rose to 1.2377 from 1.2149

This day is expected to be quite calm. Now, sellers of the pound sterling are likely to gain control over the market. Yesterday, they perfectly protected their positions and now they intend to push the price to a new weekly low. If bears manage to break the lower limit of the sideways channel located at 1.2122, which was tested several times, traders will continue selling the asset. In this light, traders should avoid buying until they are sure that there are a lot of those who want to buy the asset. In this case, the pound sterling may once again test 1.2177, the middle of the sideways channel, and consolidate above this level. Otherwise, buyers will hardly see a bullish trend. Only a rise above the mentioned level will allow the pair to resume the upward cycle. A breakout of 1.2177 and a downward test of this level will boost the price to 1.2237. The next target is located at 1.2301, where it is recommended to lock in profits. If the pound/dollar pair declines and buyers fail to protect 1.2122, bears will continue to push the price lower. In this case, it will be better to avoid long positions until the price hits 1.2061. There, traders may go long only after a false breakout. It is also possible to open buy orders just after a bounce off 1.1999, expecting a rise of 30-35 pips within the day.
Conditions for opening short positions on GBP/USD:
Bears continue to control the market and today, they are likely to gain full control over it. To do so, they should push the price below 1.2122. They may do this in the first part of the day. However, to revive the downtrend, they should first protect 1.2177, thus confirming their dominance. There, we can see bearish MAs. If the pound/dollar pair advances, only a false breakout of 1.2177 will give a sell signal with the target at the nearest support level of 1.2122. A breakout and an upward test of this level will give a sell signal with the target at a new low of 1.2061. This will intensify pressure on the pound sterling. The next target is located at 1.1999, where it is recommended to lock in profits. If the pound/dollar increases and bears fail to protect 1.2177, the pair will remain in the sideways channel. In the event of this, buyers will become active and boost the price to 1.2237. A false breakout of this level will form a sell signal. If sellers fail to be active, the pair may surge to 1.2301. There, traders should sell the asst just after a rebound, expecting a decline of 30-35 pips.

Signals of indicators:
Moving Averages
Trading is performed below 30- and 50-day moving averages, which points to bears' attempts to exert pressure on the pair.
Note: The period and prices of moving averages are considered by the author on the one-hour chart which differs from the general definition of the classic daily moving averages on the daily chart.
Bollinger Bands
If the pair breaks the upper limit of the indicator located at 1.2177, the pound sterling will resume rising. A breakout of the lower limit located at 1.2122 will intensify pressure on the pair.
Description of indicators
- Moving average (a moving average determines the current trend by smoothing volatility and noise). The period is 50. It is marked in yellow on the chart.
- Moving average (a moving average determines the current trend by smoothing volatility and noise). The period is 30. It is marked in green on the graph.
- MACD indicator (Moving Average Convergence/Divergence - convergence/divergence of moving averages). A fast EMA period is 12. A slow EMA period is 26. The SMA period is 9.
- Bollinger Bands. The period is 20.
- Non-profit speculative traders are individual traders, hedge funds, and large institutions that use the futures market for speculative purposes and meet certain requirements.
- Long non-commercial positions are the total number of long positions opened by non-commercial traders.
- Short non-commercial positions are the total number of short positions opened by non-commercial traders.
- The total non-commercial net position is a difference in the number of short and long positions opened by non-commercial traders.
 English
 Русский
 Bahasa Indonesia
 Bahasa Malay
 ไทย
ไทย Español
 Deutsch
 Български
 Français
 Tiếng Việt
 中文
中文 বাংলা
বাংলা हिन्दी
 Čeština
 Українська
 Română

