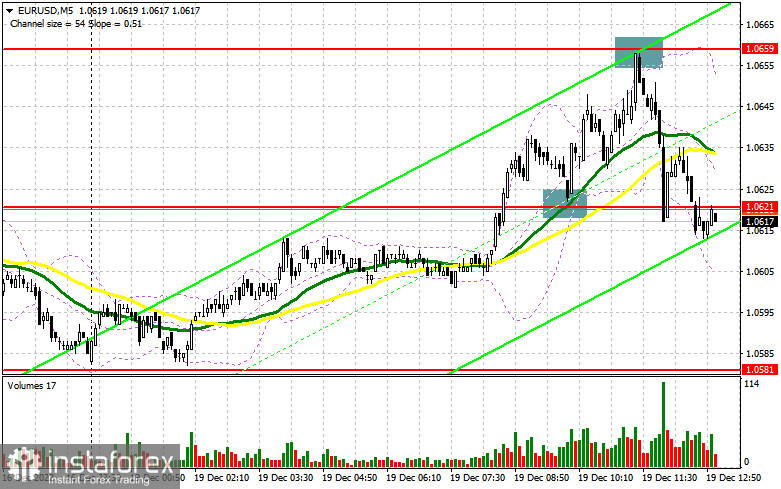
In my morning article, I underscored the levels of 1.0621 and 1.0659 and recommended planning trading positions with these levels in focus. Let's take a look at the 5-minute chart and try to figure out what actually happened in the morning. A breakout and the opposite test of 1.0621 downwards in light of decent IFO data for Germany created an excellent market entry point for long positions in the course of the upward move to 1.0659. However, a false breakout there generated a sell signal. The price actually moved 30 pips downwards.

What is needed to open long positions on EUR/USD
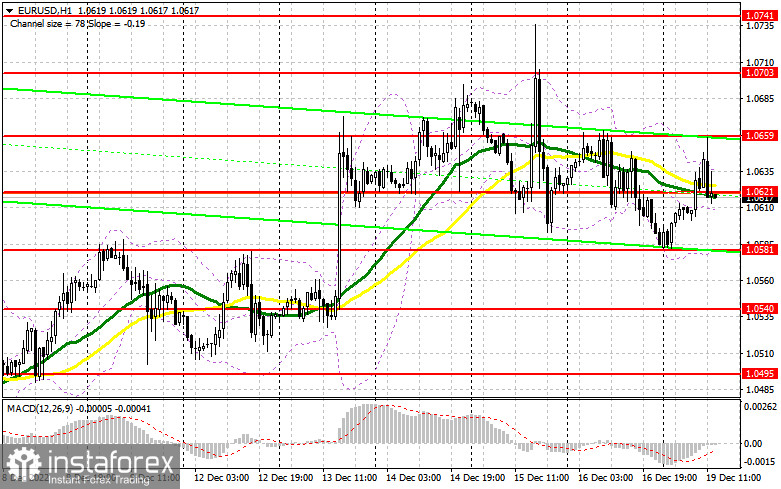
The IFO data for Germany came in to be better than expected, thus promising decent prospects for the German economy at the year-end. In the morning article, I told you that the upbeat data by IFO could encourage growth in EUR/USD amid the empty economic calendar. It is what actually happened. In the second half of the day, no other macroeconomic data is due which might soothe volatility and negate the bulls' efforts to assert themselves. The currency pair is likely to hover at around 1.0621. So I would recommend watching this level carefully. In case selling pressure escalates, we could see the price move at about 1.0581, the lower border of the trading range.
Only a false breakout there will provide a signal to enter long positions, reckoning a EUR's climb. This will open the door to 1.0621, the middle line of the trading range where moving averages are passing to the sellers' benefit. A breakout and a challenge of this range downwards will reinforce the bulls' strength, so the bulls will push the price up to 1.0659. It will be tricky to surpass this level due to a low trading volume.
A breakout of 1.0659 will open the door to the higher target at 1.0703 where I recommend profit-taking. Under the scenario of EUR/USD's decline during the North American session and if the buyers are inactive at 1.0581, EUR will come under snowballing selling pressure. This will activate some stop orders of the bulls who relied on a further uptrend. In this case, only a false breakout at about the next support of 1.0540 will be an excuse to go long. We could open long positions on EUR/USD immediately at a drop from 1.0495 or lower at about a low of 1.0446, bearing in mind a 30-35-pips intraday upward correction.
What is needed to open short positions on EUR/USD
The sellers coped with the task not immediately but they pushed the price back to 1.0621. Besides, they defended 1.0659, the upper border of the trading range. In case EUR grows again in the second half of the day, only a false breakout of the resistance at 1.0659 will provide a market entry point for short positions, aiming a decline towards the support at 1.0621. If the price breaks and settles below, having tested this level upwards, this will generate an extra signal which will be accompanied by the activation of the buyers' stop losses. Then, EUR/USD will fall to 1.0581 which will overshadow a further bullish outlook. The lowest target is seen at 1.0540 where the buyers will enter the market again and will try to buy the instrument at the bottom. In case EUR/USD moves upwards during the New York trade and if the bears are inactive at 1.0659, the sellers might lose confidence but the buyers will grasp the chance of updating the high at 1.0703. I would recommend selling from this level only at a false breakout. We could open short positions on EUR/USD immediately from a high at 1.0741, bearing in mind a downward correction of 30-35 pips.

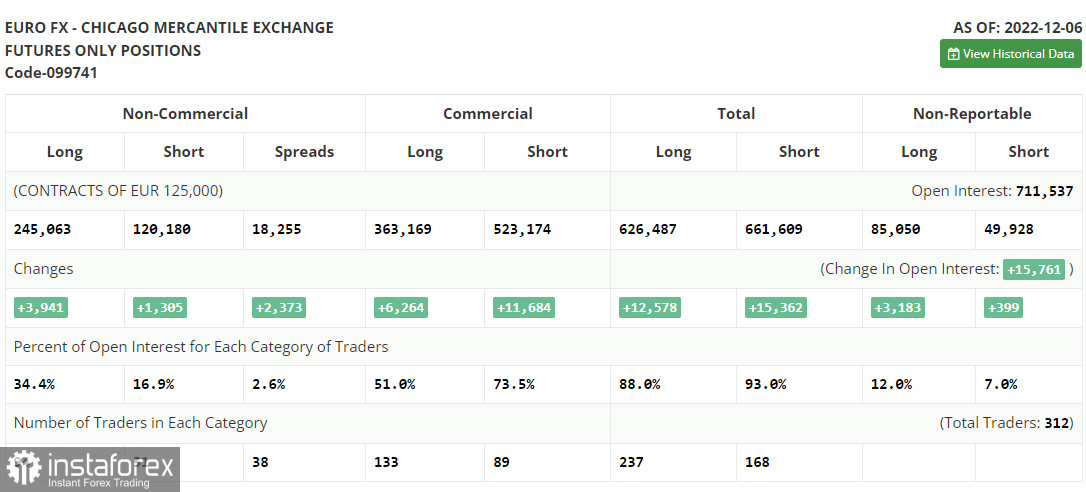
The COT report (Commitment of Traders) for December 6 recorded an increase in both long and short positions. Strong data on the US economic growth was released last week. On the other hand, traders got to know a similarly strong report on GDP growth in the Eurozone in Q3 2022, which was eventually upgraded. This maintained the demand for risky assets. Besides, the actual US CPI reading came in softer than expected in November in annual terms.
If inflation in the US continues to ebb away, a larger upward push for the euro could be expected by the end of the year. The COT report indicated that long non-commercial positions rose by 3,941 to 245,063, while short non-commercial positions jumped by 1,305 to 120,180. At the end of the week, the total non-commercial net position rose slightly to 123,113 against 122 234 a week ago. This indicates that investors are still optimistic and ready to continue buying the euro at current levels. They just need a new fundamental reason for increasing long positions. EUR/USD closed lower on Friday at 1.0315 against 1.0342 in the previous week.

Indicators' signals:
The currency pair is trading slightly below the 30 and 50 daily moving averages. It indicates that the bears are eager to wreck the uptrend.
Moving averages
Note: The period and prices of moving averages are considered by the author on the H1 hourly chart and differ from the general definition of the classic daily moving averages on the daily D1 chart.
Bollinger Bands
If EUR/USD climbs, the indicator's upper border at 1.0630 will serve as resistance.
Description of indicators
- Moving average (moving average, determines the current trend by smoothing out volatility and noise). Period 50. It is marked yellow on the chart.
- Moving average (moving average, determines the current trend by smoothing out volatility and noise). Period 30. It is marked green on the chart.
- MACD indicator (Moving Average Convergence/Divergence — convergence/divergence of moving averages) Quick EMA period 12. Slow EMA period to 26. SMA period 9
- Bollinger Bands (Bollinger Bands). Period 20
- Non-commercial speculative traders, such as individual traders, hedge funds, and large institutions that use the futures market for speculative purposes and meet certain requirements.
- Long non-commercial positions represent the total long open position of non-commercial traders.
- Short non-commercial positions represent the total short open position of non-commercial traders.
- Total non-commercial net position is the difference between short and long positions of non-commercial traders.
 English
 Русский
 Bahasa Indonesia
 Bahasa Malay
 ไทย
ไทย Español
 Deutsch
 Български
 Français
 Tiếng Việt
 中文
中文 বাংলা
বাংলা हिन्दी
 Čeština
 Українська
 Română

