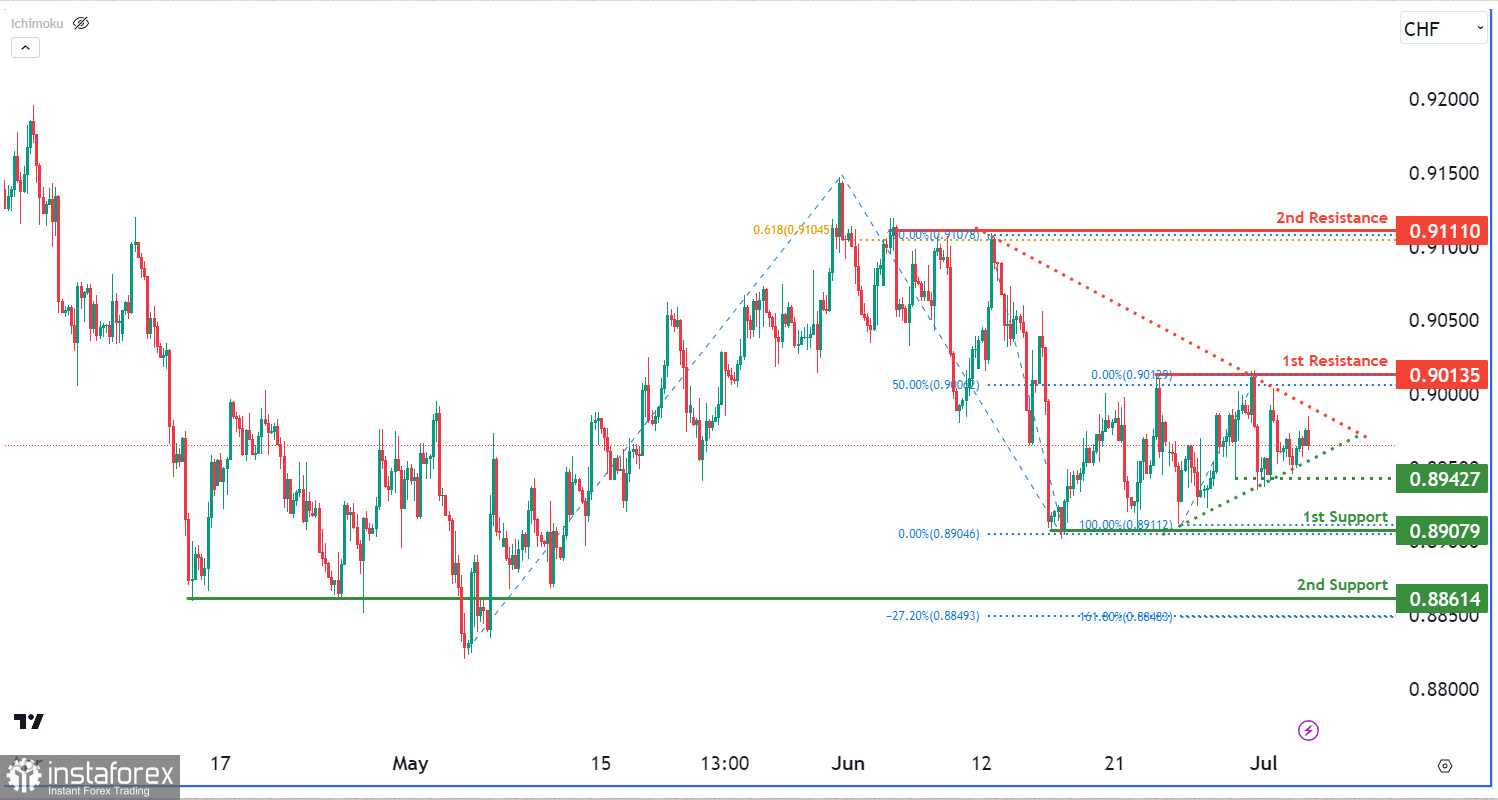
The USD/CHF chart currently shows a neutral momentum, with potential price fluctuations between the first support level at 0.8907 and the first resistance level at 0.9013. The second support level at 0.8861 and the second resistance level at 0.9111 contribute to Fibonacci confluence. Additionally, a symmetrical triangle pattern indicates consolidation, with a breakout above the upper trendline signaling a bullish move and a breakdown below the lower trendline suggesting a bearish move.
 English
 Русский
 Bahasa Indonesia
 Bahasa Malay
 ไทย
ไทย Español
 Deutsch
 Български
 Français
 Tiếng Việt
 中文
中文 বাংলা
বাংলা हिन्दी
 Čeština
 Українська
 Română

