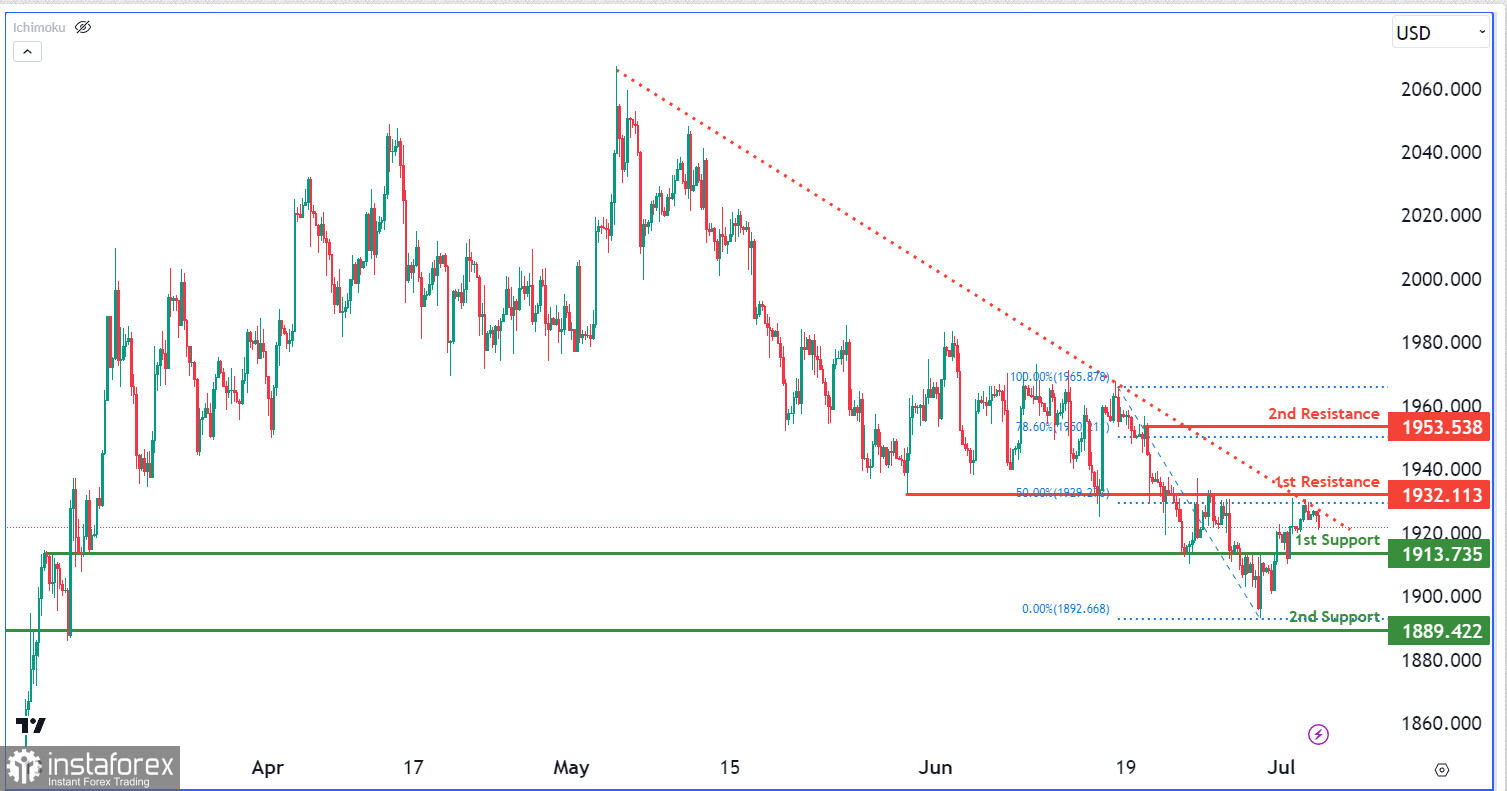
The XAU/USD chart indicates a bearish momentum, suggesting further downward movement due to the price being below a major descending trend line.
There is potential for a bearish continuation towards the first support level at 1913.73, which is an overlap support. The second support level at 1889.42 also acts as an overlap support.
On the upside, the first resistance level at 1932.11 is an overlap resistance with the 50% Fibonacci Retracement. The second resistance level at 1953.53 coincides with the 78.60% Fibonacci Retracement and represents a swing high resistance.
 English
 Русский
 Bahasa Indonesia
 Bahasa Malay
 ไทย
ไทย Español
 Deutsch
 Български
 Français
 Tiếng Việt
 中文
中文 বাংলা
বাংলা हिन्दी
 Čeština
 Українська
 Română

