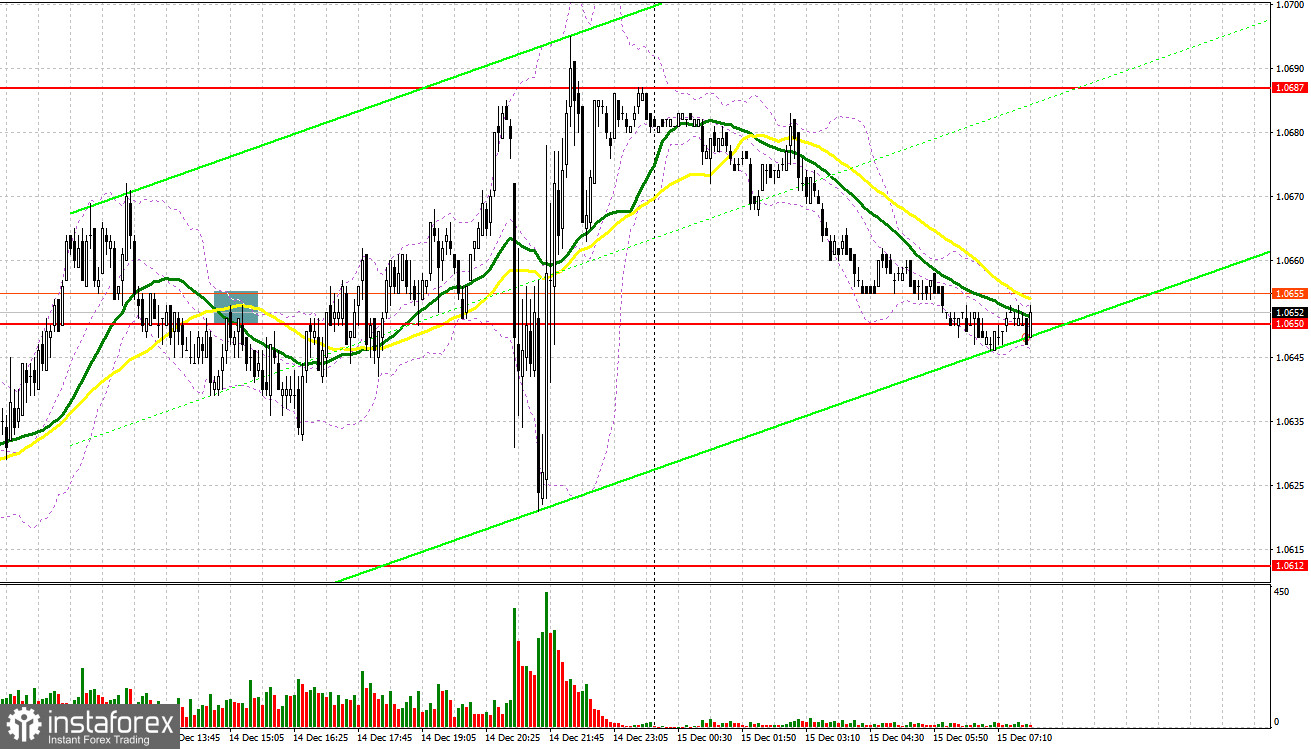
Yesterday, traders received just one signal to enter the market. Let us take a look at the 5-minute chart to clear up the market situation. Earlier, I asked you to pay attention to the level of 1.0655 to decide when to enter the market. Although the pair climbed to this level it failed to form a false breakout and a sell signal. Thus, in the first part of the day, there were no entry points. During the US trade, the pair dropped below 1.0650 and upwardly tested the level, thus allowing traders to open sell orders. However, the pair did not show a considerable decline. It slid by just 18 pips.

Conditions for opening long positions on EUR/USD
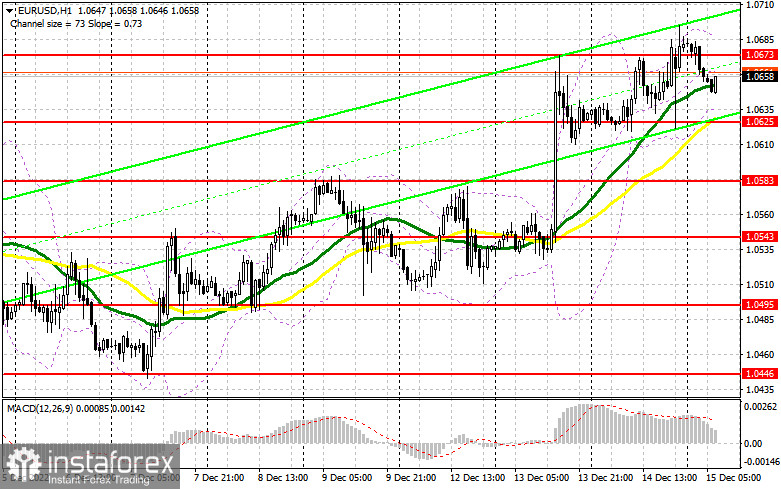
Yesterday, the US Fed raised the benchmark rate by 50 basis points to the level of 4.25%-4.50%. According to the forecasts, the interest rates will reach their highs at the level of 5.1% only in the next year. It means that the regulator is unlikely to stop the monetary policy tightening in the near future. This fact allowed the US dollar to keep its position against the euro. Today, the ECB will also unveil its key rate decision and monetary policy report. After that, Christine Lagarde will hold a press conference to disclose the ECB's plans. It is obvious that the ECB will follow the steps of the Fed and decide to slacken the pace of the key interest rate. Thus, the benchmark rate could be raised by just 0.5%. Traders have already priced in this information. In this light, the euro may lose value. If the euro/dollar pair declines, it will be better to buy after a false breakout near the closest support level of 1.0625. This will give a buy signal with the target at 1.0673, a resistance level formed yesterday. A breakout and a downward test of this level will give an additional buy signal with the target at 1.0714, a new high of December. Notably, the pair will climb above this level only amid weak data from the US. A downward test of 1.0714 will affect bears' stop orders and give an additional buy signal with the target at 1.0741, where it is recommended to lock in profits. If the euro/dollar pair declines and buyers fail to protect 1.0625, pressure on the pair will increase, thus causing a slight correction. A breakout of 1.0625 will push the price to the next support level of 1.0583. There, traders may go long after a false breakout. Traders may also initiate buy orders after a bounce off 1.0543 or even lower – from 1.0495, expecting a rise of 30-35 pips within the day.
Conditions for opening short positions on EUR/USD:
Sellers are expected to become more active, especially amid the fact that Jerome Powell disappointed buyers yesterday. If the ECB chooses a less hawkish approach, bears will become active by the end of the week. That is why under the current conditions it will be better to sell after a false breakout of the new resistance level of 1.0673. This will lead to a decline to the support level of 1.0625, where there are bullish MAs. A breakout and a test of this area will exert pressure on the euro, thus forming an additional sell signal with the target at 1.0583. If the price settles below this area, it is likely to slide to 1.0543. This will also boost the likelihood of the bearish sentiment. The farthest target is located at 1.0495, where it is recommended to lock in profits. If the euro/dollar pair increases during the European session and bears fail to protect 1.0673, the price may jump to 1.0714, a new high of this month. There, traders may also go short after an unsuccessful settlement. It is also possible to sell the asset just after a rebound of the high of 1.0741, expecting a drop of 30-35 pips.

COT report
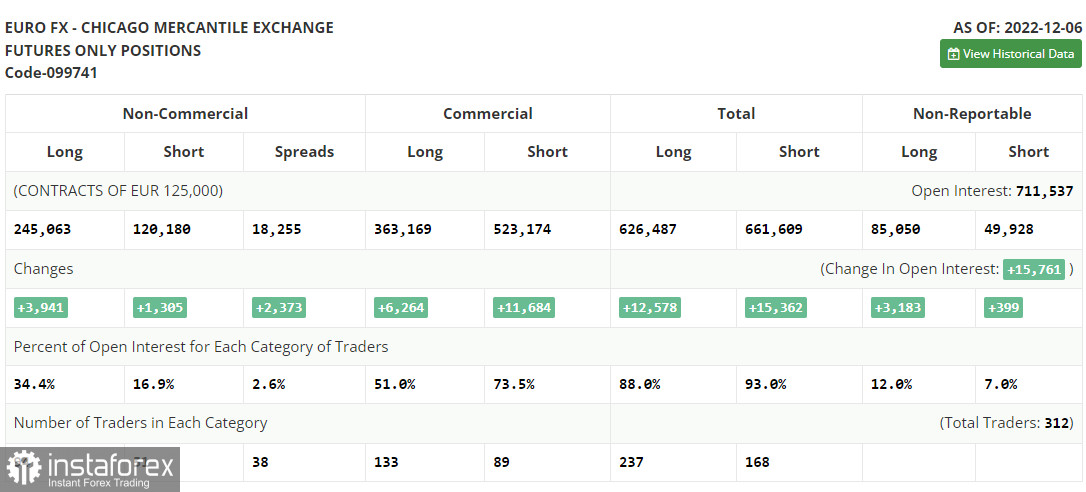
According to the COT report from December 6, the number of both long and short positions increased. Strong business activity data from the US slightly overshadowed the eurozone GDP report for the third quarter, which was upwardly revised. Thanks to this demand for risk assets remained intact. However, the situation may alter this week because of the publication of the US inflation figures. Notably, the US inflation may rise against the forecast. In this case, the market situation will change again. Later, the Fed will hold a meeting. Jerome Powell may switch to a more hawkish stance, thus supporting the greenback. If inflation continues falling, the euro may show a jump by the end of the year. The COT report unveiled that the number of long non-commercial positions increased by 3,941 to 245,063, while the number of short non-commercial positions rose by 1,305 to 120,180. At the end of the week, the total non-commercial net position increased slightly to 123,113 against 122,234. This indicates that investors are still optimistic and are ready to continue buying the euro at current levels. They just need a new fundamental reason. The weekly closing price decreased to 1.0315 from 1.0342.

Signals of indicators:
Moving Averages
Trading is performed slightly above 30- and 50-day moving averages, which still reflects the bullish sentiment.
Note: The period and prices of moving averages are considered by the author on the one-hour chart which differs from the general definition of the classic daily moving averages on the daily chart.
Bollinger Bands
If the pair advances, a resistance level could be seen at 1.0675, the upper limit of the indicator. In case of a decline, the lower limit of the indicator located at 1.0625 will act as support.
Description of indicators
- Moving average (moving average, determines the current trend by smoothing volatility and noise). The period is 50. It is marked in yellow on the chart.
- Moving average (moving average, determines the current trend by smoothing volatility and noise). The period is 30. It is marked in green on the graph.
- MACD indicator (Moving Average Convergence/Divergence - convergence/divergence of moving averages). A fast EMA period is 12. A slow EMA period is 26. The SMA period is 9.
- Bollinger Bands. The period is 20.
- Non-profit speculative traders are individual traders, hedge funds, and large institutions that use the futures market for speculative purposes and meet certain requirements.
- Long non-commercial positions are the total number of long positions opened by non-commercial traders.
- Short non-commercial positions are the total number of short positions opened by non-commercial traders.
- The total non-commercial net position is a difference in the number of short and long positions opened by non-commercial traders.
 English
 Русский
 Bahasa Indonesia
 Bahasa Malay
 ไทย
ไทย Español
 Deutsch
 Български
 Français
 Tiếng Việt
 中文
中文 বাংলা
বাংলা हिन्दी
 Čeština
 Українська
 Română

