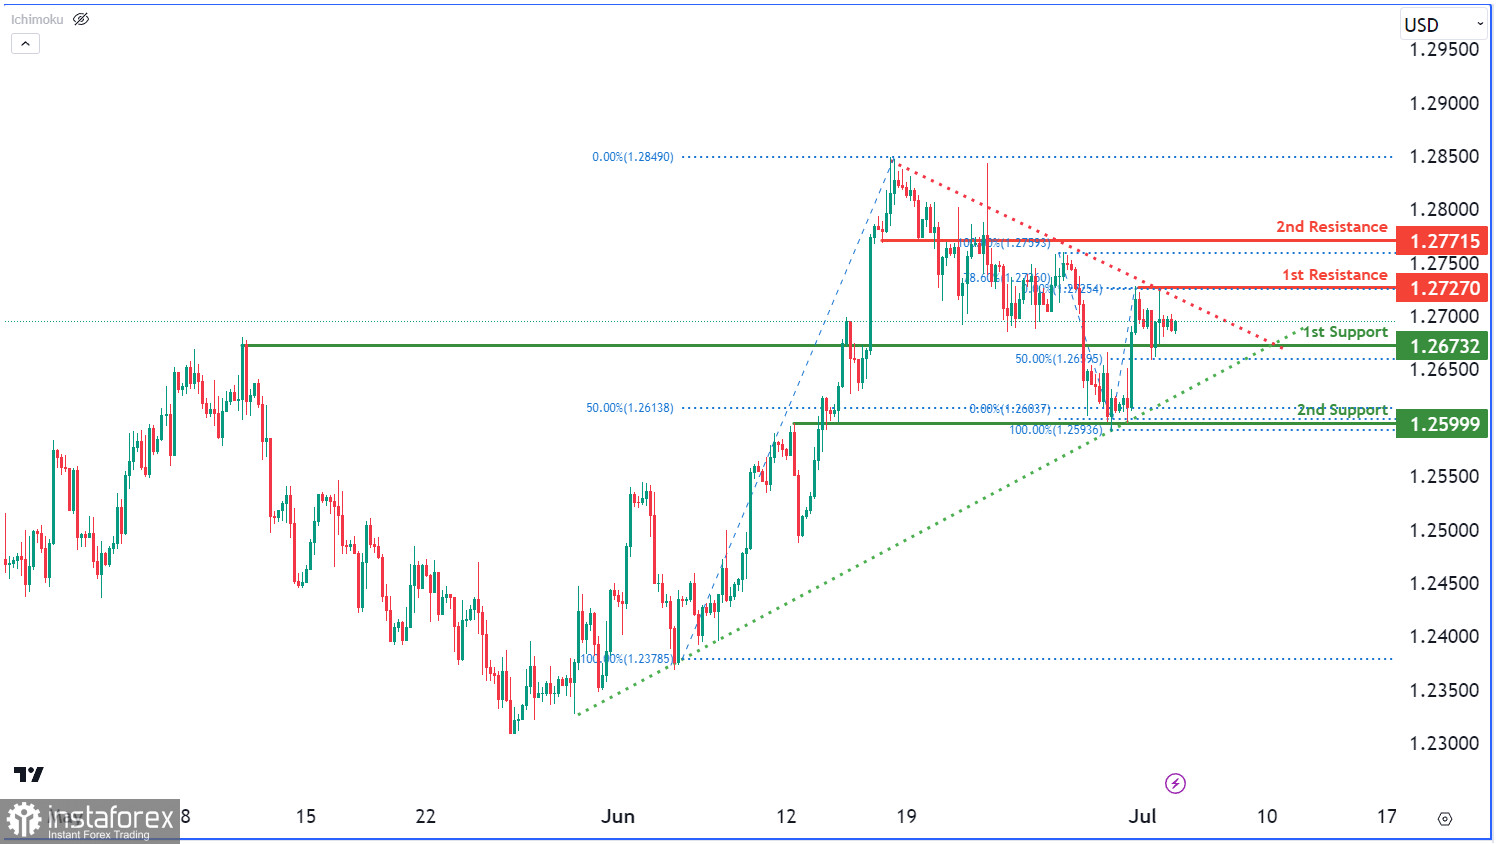
GBP/USD chart shows a neutral momentum, lacking clear direction. Price may fluctuate between the 1st resistance at 1.2727 and the 1st support at 1.2673. Supports include overlaps and Fibonacci Retracement, while resistances are multi-swing highs and overlaps. A symmetrical triangle pattern suggests consolidation, with potential for bullish or bearish breakout
 English
 Русский
 Bahasa Indonesia
 Bahasa Malay
 ไทย
ไทย Español
 Deutsch
 Български
 Français
 Tiếng Việt
 中文
中文 বাংলা
বাংলা हिन्दी
 Čeština
 Українська
 Română

