M5 chart of EUR/USD

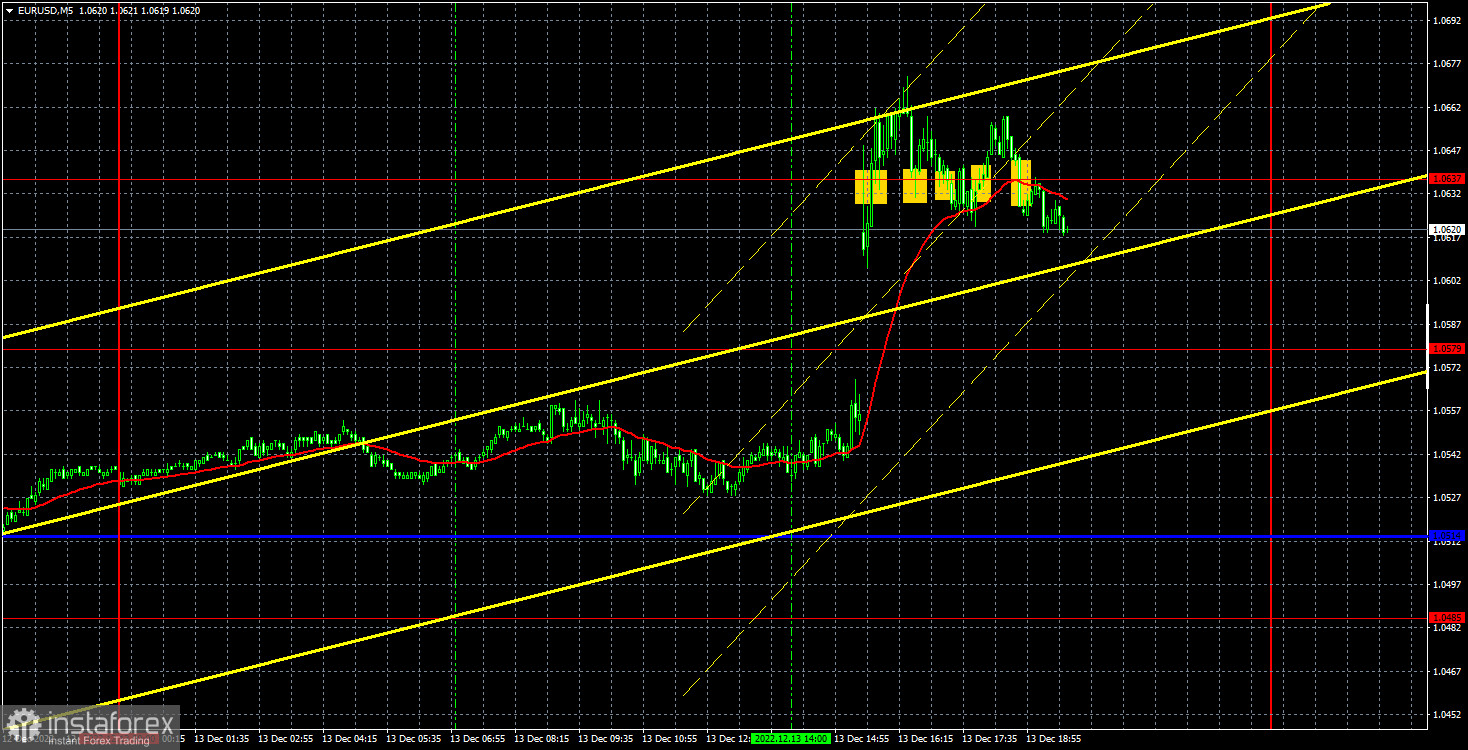
EUR/USD went up again on Tuesday, although it only grew because of the US inflation report. However, this report was worth a lot. Recall that inflation is the main determinant of the Federal Reserve's monetary policy now, so this report is even more important than the Fed meeting itself. That's why it's no surprise that the dollar fell 110 points in just half an hour when the market learned about a bigger than expected decline in the Consumer Price Index. And there were no other major events or announcements during the day. But there was no need for that. The euro kept the positive mood and in theory can continue rising against the dollar. I still expect a strong bearish correction, but this week (I warned you) the pair's movement could be almost anything.
Tuesday's trading signals were bad. Unfortunately, we failed to catch the beginning of the upward movement, so the first signal was formed after the inflation report was released, and also when the upward movement was almost over. Therefore, the buy signal near 1.0637 should not be worked out. As well as all succeeding signals to buy near this level. There were also two sell signals, but both of them were created quite late, so there was no point in taking a risk and trying to gain some tens of points using them. The best option was not to open positions at all on Tuesday. Moreover, all the signals near 1.0637 turned out to be false.
COT report

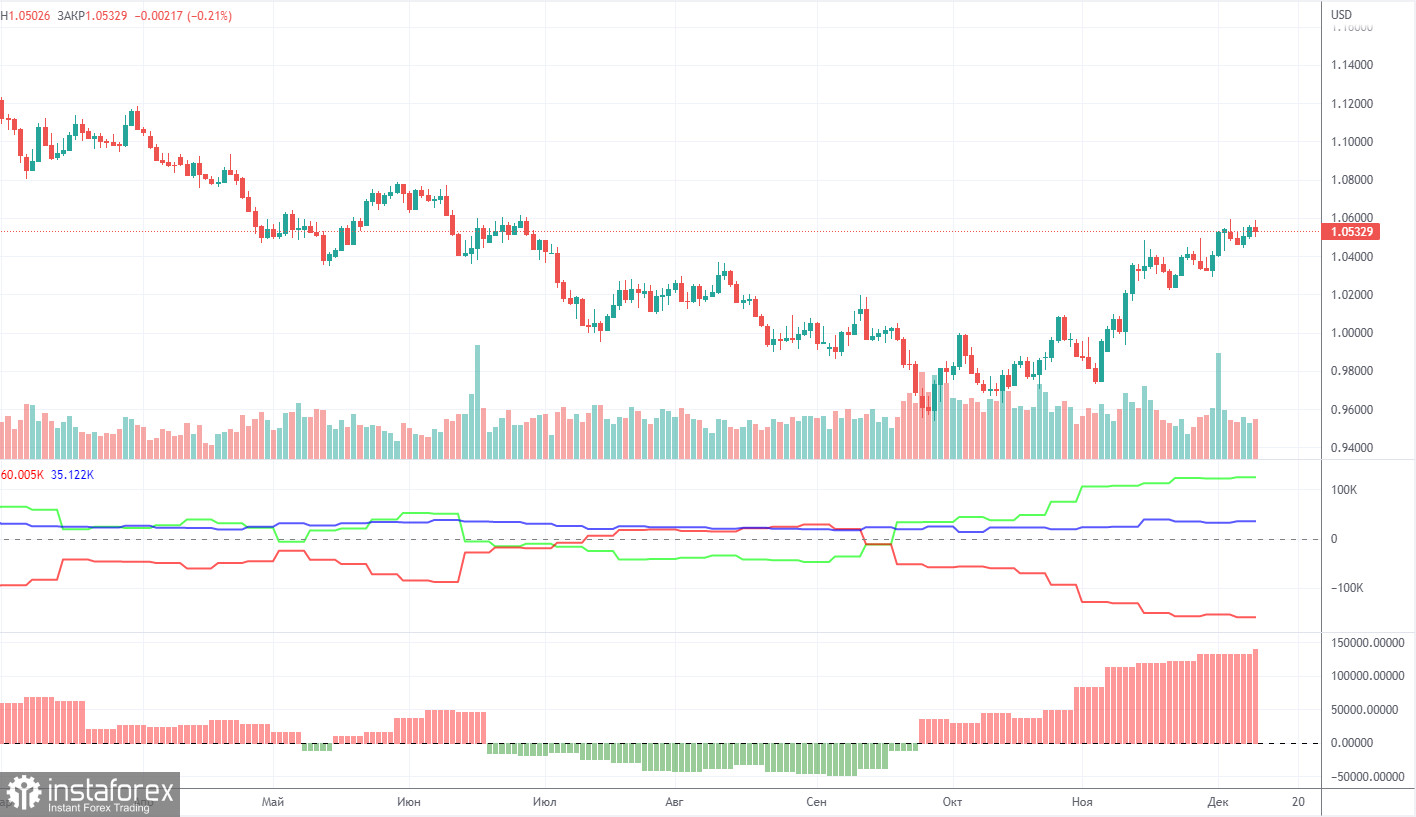
COT reports on EUR/USD have puzzled traders through most of 2022. Half of the year, COT reports indicated clear-cut bullish sentiment among large market makers while the single European currency was extending its weakness. For a few months, the reports showed a bearish sentiment and the euro was also trading lower. Currently, the net position of non-commercial traders is again bullish and increasing. Although the euro is rising, a rather high value of the net position allows us to assume an early completion of the uptrend. During the reporting week, the number of long positions held by non-commercial traders increased by 3,900 and that of short positions grew by 1,300. Accordingly, the net position grew by about 2,600 contracts. The green and red lines of the first indicator moved far away from each other, which could mean the end of the uptrend (!!!) (which, in fact, never happened). The number of long positions exceeds that of short positions by 125,000. Therefore, the net position of non-commercial traders may continue to rise further but without triggering a similar rise in the euro. When it comes to the total number of longs and shorts across all categories of traders, there are now 35,000 more short positions (661,000 vs 626,000).
H1 chart of EUR/USD

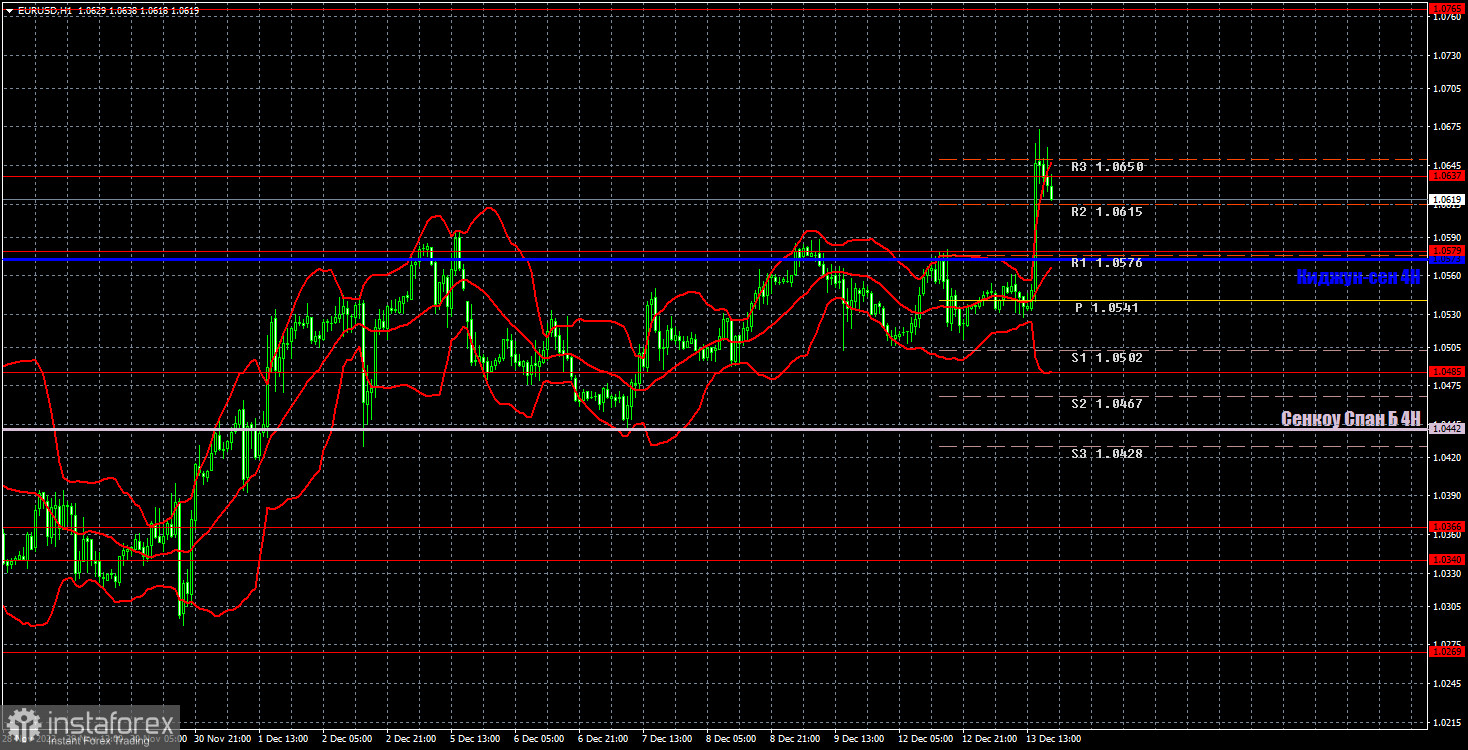
On the one-hour chart, EUR/USD is still near its local highs, but this week traders will have so many events and reports that they can use that it is impossible to say which way the price will move further and where the current week will end. The U.S. dollar could still show gains even if Fed Chairman Jerome Powell shows a dovish stance. On Wednesday, the pair may trade at the following levels: 1.0340-1.0366, 1.0485, 1.0579, 1.0637, 1.0765, 1.0806, and the Senkou Span B (1.0442) and Kijun Sen (1.0573). Lines of the Ichimoku indicator may move during the day, which should be taken into account when determining trading signals. There are also support and resistance levels, but signals are not formed near these levels. Bounces and breakouts of the extreme levels and lines could act as signals. Don't forget about stop-loss orders, if the price covers 15 pips in the right direction. This will prevent you from losses in case of a false signal. On December 14, the European Union will publish the Industrial Production report and the results of the Fed meeting will be announced in the US. The results will be known late in the evening, when intraday traders should have left the market. You can stay if you put Stop Loss.
What we see on the trading charts:
Price levels of support and resistance are thick red lines, near which the movement may end. They do not provide trading signals.
The Kijun-sen and Senkou Span B lines are the lines of the Ichimoku indicator, moved to the one-hour chart from the 4-hour one. They are strong lines.
Extreme levels are thin red lines from which the price bounced earlier. They provide trading signals.
Yellow lines are trend lines, trend channels, and any other technical patterns.
Indicator 1 on the COT charts reflects the net position size of each category of traders.
Indicator 2 on the COT charts reflects the net position size for the non-commercial group.
 English
 Русский
 Bahasa Indonesia
 Bahasa Malay
 ไทย
ไทย Español
 Deutsch
 Български
 Français
 Tiếng Việt
 中文
中文 বাংলা
বাংলা हिन्दी
 Čeština
 Українська
 Română

