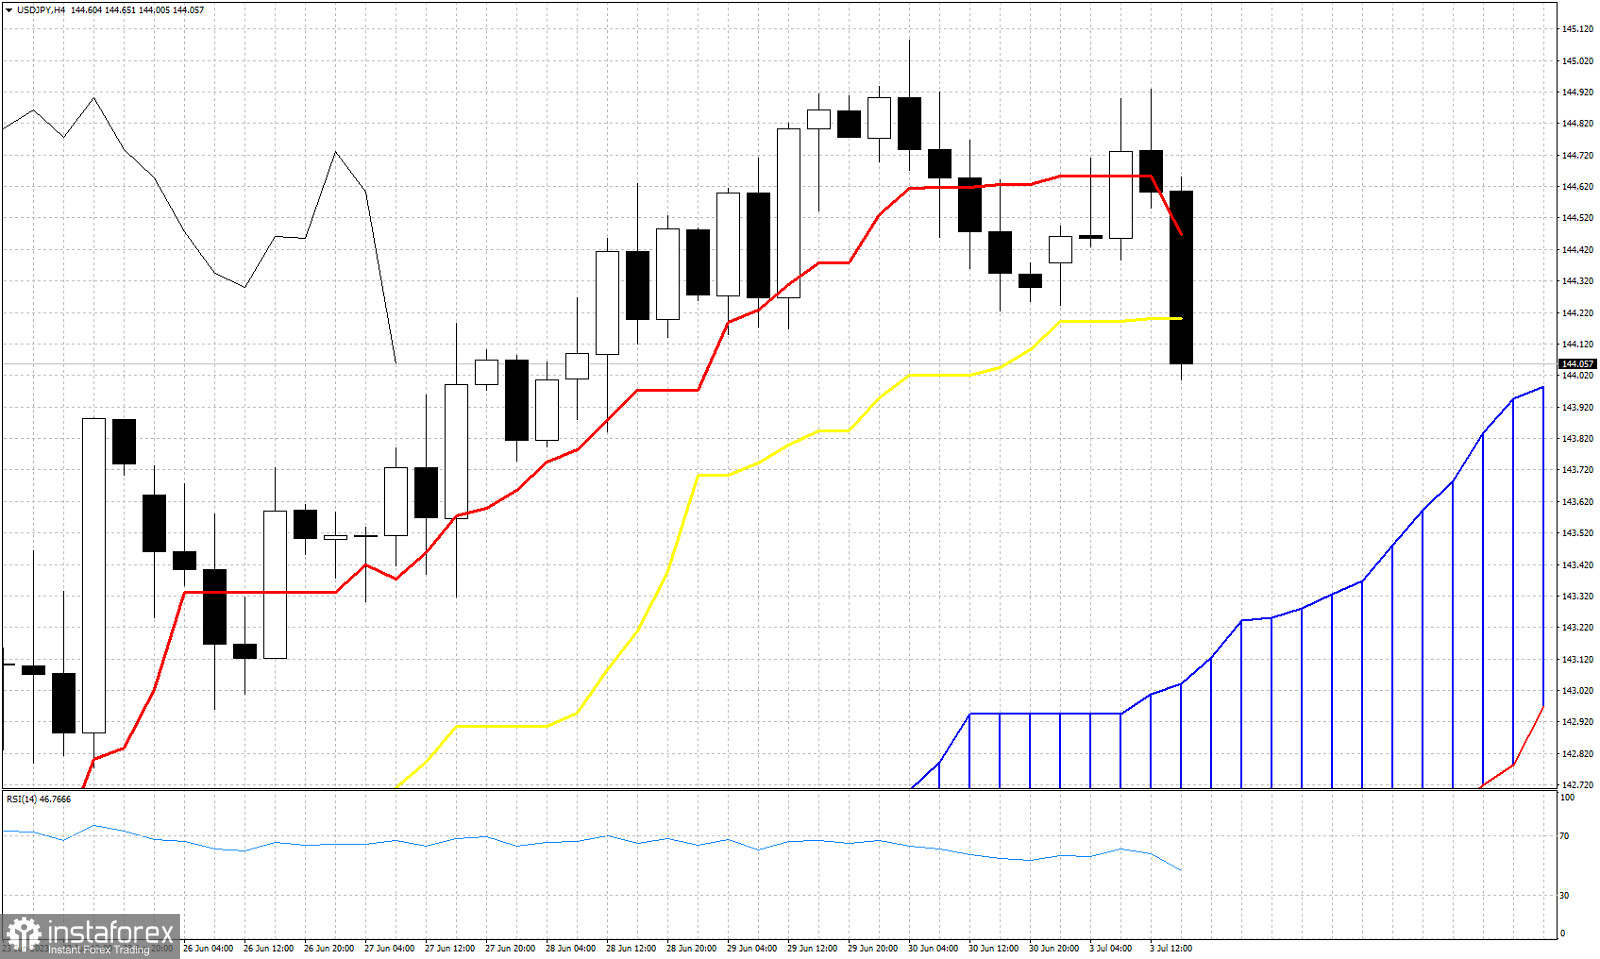
USDJPY is trading around 144.07 after making a high around 145.08. In the 4 hour chart using the Ichimoku cloud indicator we get the first reversal warning signs. USDJPY has been in an up trend making higher highs and higher lows since the beginning of June and 139 price level. Short-term trend remains bullish since June 14th and the close above the Kumo at 140. Price is now starting to making lower lows and lower highs as it breaks below the tenkan-sen (Red line indicator) and the kijun-sen (yellow line indicator). The Chikou span (black line indicator) remains above the canldestick pattern (bullish). However the break below the kijun-sen is a sign of vulnerability and increases the chances of a pull back to test the upper cloud boundary at 143.25. So traders need to be cautious because a pull back towards the 143 level is highly probable.
 English
 Русский
 Bahasa Indonesia
 Bahasa Malay
 ไทย
ไทย Español
 Deutsch
 Български
 Français
 Tiếng Việt
 中文
中文 বাংলা
বাংলা हिन्दी
 Čeština
 Українська
 Română

