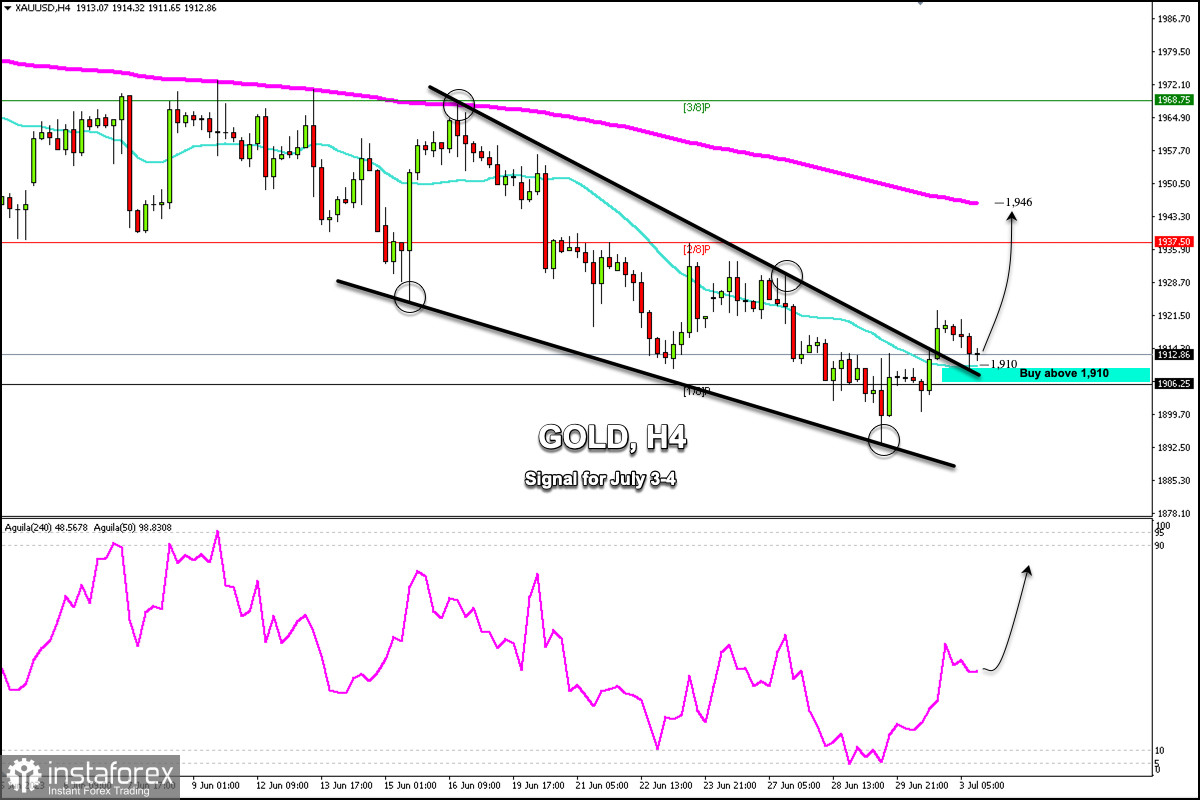
Early in the American session, gold (XAU/USD) is trading at 1,986 above the 21 SMA and above the symmetrical triangle pattern that was broken last week. We may see a correction from the 1,922 high towards the 21 SMA, but this could confirm the pattern's breakout and a signal for the bullish cycle to resume.
From the low of 1,892.95, gold has made a strong technical rebound. The odds are now that it could continue to rise in the next few days and it could reach the 200 EMA located at 1,946.
The daily pivot point can be found at 1,912. In case gold consolidates above this level in the next few hours, we could expect an upward acceleration and it could reach 2/8 Murray at 1,937 and finally, climb to the 200 EMA of around 1,946.
Additionally, the weekly pivot point is located at 1,914. If gold consolidates above this level in the next few days, we could expect a sustained recovery towards the key area of 1,968 (3/8 Murray).
In the short term, further rises are expected but the price is likely to reach only the area of 1,970 and up to the psychological level of $2,000. On the downside, the yellow metal is facing immediate support around 1,892. A daily close below this level could cover a gap left on March 10 at 1,967.
On the daily charts, gold has found support at the 200 EMA located at 1,994. It suggests that if it trades above this level in the next few days, there is a strong possibility of a gold recovery. The Eagle indicator is giving a positive signal on the daily chart which supports our bullish strategy.
 English
 Русский
 Bahasa Indonesia
 Bahasa Malay
 ไทย
ไทย Español
 Deutsch
 Български
 Français
 Tiếng Việt
 中文
中文 বাংলা
বাংলা हिन्दी
 Čeština
 Українська
 Română

