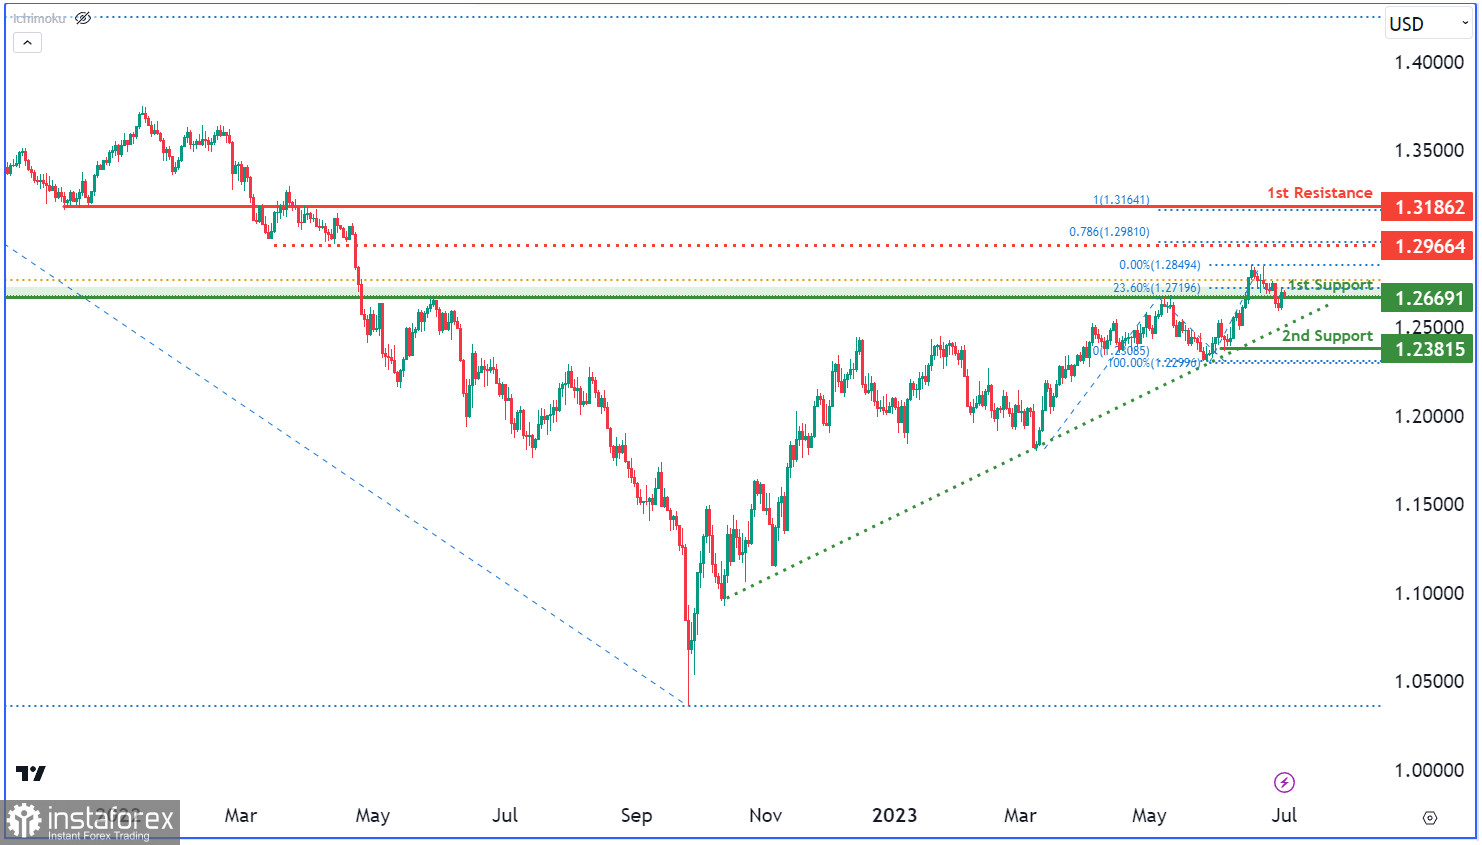
The GBP/USD chart currently shows a bullish momentum, indicating a potential for further upward movement in the market. This is supported by the price being above a significant ascending trend line, suggesting a continuation of the bullish trend.
There is a possibility of a bullish bounce off the first support level at 1.2669. This support level is considered an overlap support and is further strengthened by the presence of the 23.60% Fibonacci Retracement. Additionally, the second support level at 1.2381 represents a swing low support.
On the upside, the first resistance level at 1.3186 acts as an overlap resistance. Furthermore, an intermediate resistance level at 1.2966 functions as a pullback resistance.
 English
 Русский
 Bahasa Indonesia
 Bahasa Malay
 ไทย
ไทย Español
 Deutsch
 Български
 Français
 Tiếng Việt
 中文
中文 বাংলা
বাংলা हिन्दी
 Čeština
 Українська
 Română

