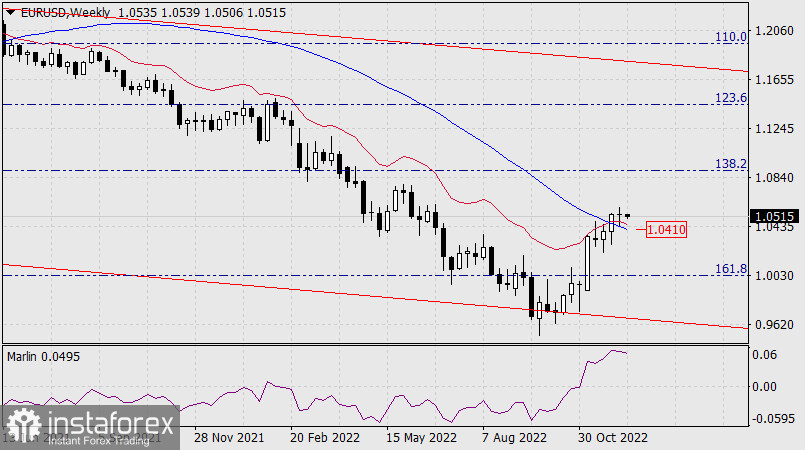
Last week it nearly closed at the opening level. The price did not approach the MACD line on the weekly chart, and the MACD line moved lower, settling in the area where support is at 1.0410.

The price has lost a major thing - momentum. Now it will be harder to overcome the MACD line. Being able to do so will open the target level at 1.0205 (high on September 12). Anyway, the weekly candlestick is already moving above the MACD line, and the only thing that can stop the price from going up is the outcome of the Federal Reserve meeting.

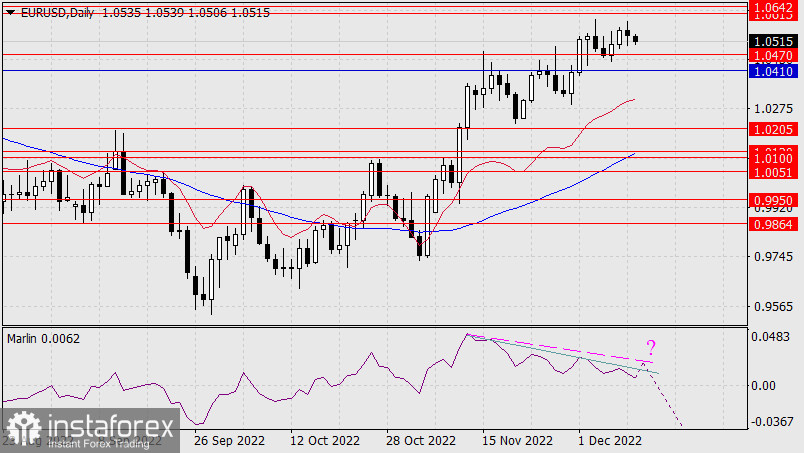
On the daily chart, the divergence and its angle are still unclear. Either the divergence has formed, or the price will reach the target range at 1.0615/42, and the divergence will form along the less steep slope.

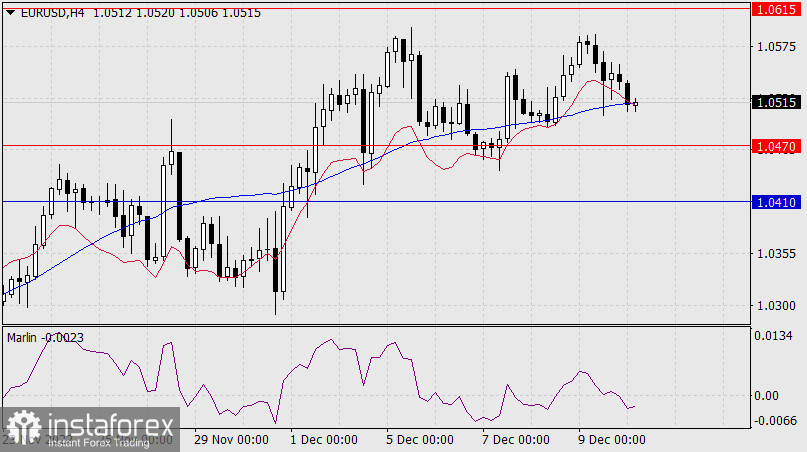
On the four-hour chart, the Marlin oscillator has penetrated into the bears' area. The price has crossed the area under the support of the MACD line and under the balance line (red sliding line). There is a high probability of a downward movement.
 English
 Русский
 Bahasa Indonesia
 Bahasa Malay
 ไทย
ไทย Español
 Deutsch
 Български
 Français
 Tiếng Việt
 中文
中文 বাংলা
বাংলা हिन्दी
 Čeština
 Українська
 Română

