Yesterday, GBP/USD produced a few signals for market entry. Let's analyze the 5-minute chart and speak about the price developments. In the previous review, I turned your attention to the level of 1.2179 and recommended adjusting your decisions to this level. A decline and a false breakout at that level set the stage for increasing long positions, following yesterday's bias, but the market went wrong. A short time later, the level of 1.2179 was broken, thus activating stop losses. In the second half of the day, the bulls insisted on a breach of 1.2210. During the opposite test of this level, we got a buy signal which brought traders a profit of about 30 pips.

What is needed to open long positions on GBP/USD
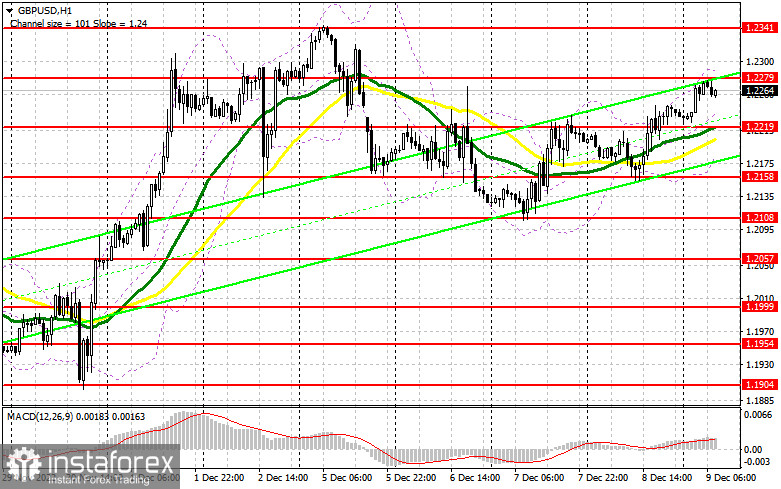
GBP buyers coped with their tasks and wrecked the bearish correctional channel which had been underway since the beginning of the week. Though the growth was not rapid and the price didn't touch December highs yet, the odds are that it will happen. Amid the empty economic calendar in the first half of the day, the buyers are likely to set the tone for the pair. We could expect a breakout of the nearest resistance at about 1.2279. For a more realistic buy scenario, I'd like to see a decline in GBP/USD and a false breakout at about 1.2219 where moving averages are passing which benefit the buyers. This will give us an entry point, enabling traders to push the price to 1.2279, an intraday high. Once this level is taken out, we could rely on a higher high than December high at 1.2341. A climb higher will open the door to a higher level of 1.2410 where I recommend profit-taking. If the bulls don't cope with this task and miss 1.2219, it would be better not to rush buying the pair. We would rather open long positions during a downward retracement and a false breakout at 1.2158. We could buy GBP/USD immediately at a drop from 1.2108, bearing in mind a 30-35-pips intraday upward correction.
What is needed to open short positions on GBP/USD
The sellers find it difficult to lock the pair in a trading range. For this, they need to hold the upper hand at the nearest resistance of 1.2279. A false breakout there would be a good sell signal if we reckon a decline to support at 1.2219. This level is going to be challenged because the bears will gain extra advantage when they regain control over it. A breakout and the opposite test of this level upwards will generate a sell entry point predicting a test of 1.2158. Yesterday, the buyers traded actively from this level. The lowest target is seen at 1.2108, the lowest point of the week, where I recommend profit-taking. In case GBP/USD grows and the bears lack activity at 1.2279 which is a realistic scenario in light of yesterday's developments, the market will remain under the bears' control. Only a false breakout at about 1.2341, a one-month high, will provide a market entry point for short positions, aiming for a downward move. In case, there is no activity there, I would recommend selling GBP/USD immediately at a high of 1.2410, bearing in mind a drop of 30-35 pips intraday.

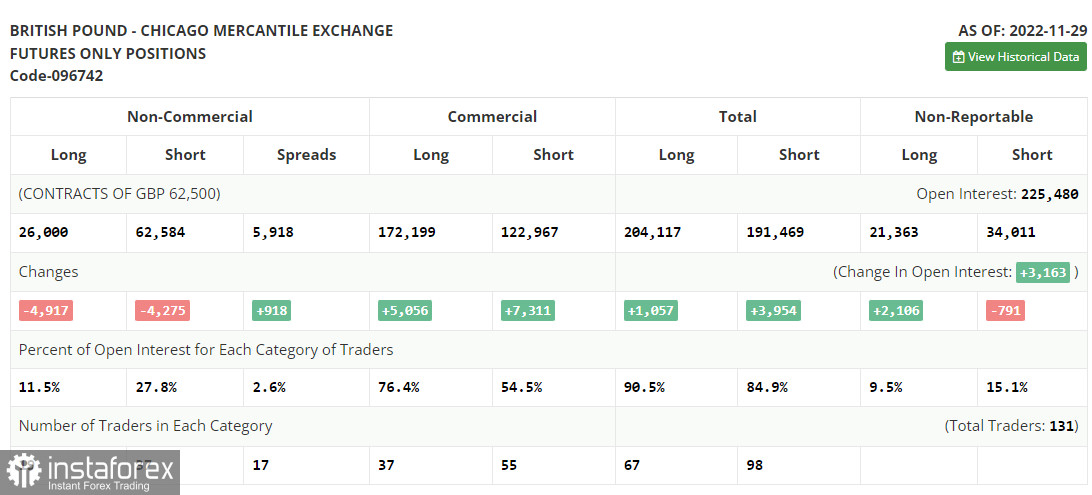
In the COT report (Commitment of Traders) for November 29, both short positions and long positions continued to decline. Obviously, the recent statistics are not optimistic. Both the British manufacturing sector and the service sector have been losing momentum. Dismal macroeconomic data warns of a looming recession. Remarkably, the Bank of England does not intend to take efficient measures to prevent a recession because the top priority is to adopt countermeasures against soaring inflation, which has been sharply accelerating as the latest data proved. Against this background, it is not surprising why traders prefer to stay on the sidelines. They are hesitating either to buy or sell the pound sterling.
If you look at how much the pair has risen since November this year, it doesn't make sense to go long at the current highs at all. The US economy has revealed its resilience, which will certainly boost demand for the dollar after the Federal Reserve meeting next week. The latest COT report indicated that long non-commercial positions decreased by 4,197 to 26,000, while short non-commercial positions declined by 4,275 to 62,584, which led to an increase in the negative value of the non-commercial net position to -36,584 against -35,942 a week earlier. GBP/USD closed higher last week at 1.1958 against 1.1892 in the previous week.

Indicators' signals:
The currency pair is trading above the 30 and 50 daily moving averages. It indicates that the buyers are holding the upper hand in the market.
Moving averages
Note: The period and prices of moving averages are considered by the author on the H1 hourly chart and differ from the general definition of the classic daily moving averages on the daily D1 chart.
Bollinger Bands
If GBP/USD goes down, the indicator's upper border at 1.2279 will serve as resistance.
Description of indicators
- Moving average (moving average, determines the current trend by smoothing out volatility and noise). Period 50. It is marked yellow on the chart.
- Moving average (moving average, determines the current trend by smoothing out volatility and noise). Period 30. It is marked green on the chart.
- MACD indicator (Moving Average Convergence/Divergence — convergence/divergence of moving averages) Quick EMA period 12. Slow EMA period to 26. SMA period 9
- Bollinger Bands (Bollinger Bands). Period 20
- Non-commercial speculative traders, such as individual traders, hedge funds, and large institutions that use the futures market for speculative purposes and meet certain requirements.
- Long non-commercial positions represent the total long open position of non-commercial traders.
- Short non-commercial positions represent the total short open position of non-commercial traders.
- Total non-commercial net position is the difference between short and long positions of non-commercial traders.
 English
 Русский
 Bahasa Indonesia
 Bahasa Malay
 ไทย
ไทย Español
 Deutsch
 Български
 Français
 Tiếng Việt
 中文
中文 বাংলা
বাংলা हिन्दी
 Čeština
 Українська
 Română

