On Wednesday, the EUR/USD currency pair kept moving. Since there are no fundamental or macroeconomic backgrounds, such a movement today shouldn't be considered surprising in theory. Yesterday, the pair was able to adjust to the moving average line once more but failed to get past it. As a result, the upward trend is still present, and the US dollar still needs to grow, as we have been hoping for more than two weeks. Despite the technical picture, we do not even see general signs that the pair is ready to start correcting, as all indicators continue to signal an upward movement. Typically, as an impulse approaches completion, each peak moves steadily closer to the previous one. Nothing comparable can be found today. In the absence of significant news or events, the market pauses but does not close long positions. And for that reason, there is no correction. Similar circumstances existed with the US dollar for a protracted period, as the pair could not move higher by more than 400 points. The situation is now reversed.
The lack of current growth factors in the euro currency is what I find most intriguing. If they could have been located a week or two ago (and then only with a strong desire), they are now impossible to locate. There were two more or less important reports this week, one on Monday and two on Wednesday. Retail sales in the European Union fell short, and the US ISM index turned out to be stronger than expected. This week's overall score is 2:1 in favor of the dollar as a result of yesterday's report on the third quarter of EU GDP coming in slightly higher than expected. However, the US dollar could not reap any particular benefits from this. It is currently unable to gain a foothold beneath the moving.
The market has forgotten the "tough" stance taken by the Fed.
The European currency did not increase in value over the past month for unique reasons, as we have recently stated on numerous occasions. Some factors support the US dollar, but you can find individual reports that back the euro, and you can recall the Fed's readiness to start easing up on the pace of tightening monetary policy. The European currency has grown too much compared to the available resources, even though it has grown reasonably. There is now a lull, but the two cannot start adapting. In light of this, it is currently unnecessary to consider and analyze macroeconomics' "foundation." Why would you do this if the market is already buying? This is sarcasm because no one can predict when market participants will realize that you can sell and buy.
We need to pay attention to upcoming meetings of the Fed or the ECB in light of recent changes in the foreign exchange market. It is well known that the ECB will most likely increase rates by 0.75% and that the Fed will only increase rates by 0.50%. Even considering this factor, the euro has already grown too much. It may, however, currently support the euro currency. In any case, a correction is overdue at this point. We will wait for a downward correction even if it turns out tomorrow that the ECB tightens monetary policy more than the Fed. However, we also want to remind you that with specific technical indicators and support, it would be a good idea to sell the pair right now. The situation is as follows: you must wait for a correction and be prepared for it, but it is also advised to only open short positions in the presence of signals. The market is currently trading irrationally, and this irrationality might last for a while. Additionally, it brought about the unjustified strengthening of the euro.

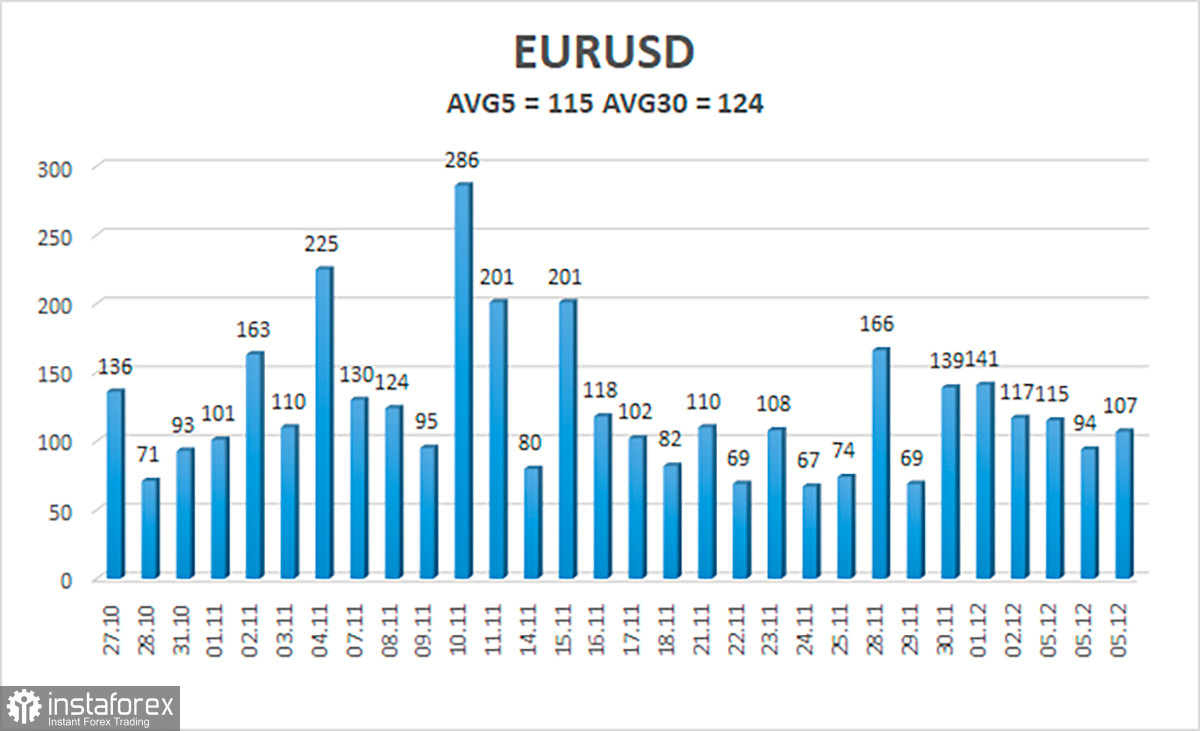
As of December 8, the euro/dollar currency pair's average volatility over the previous five trading days was 115 points, which is considered "high." So, on Thursday, we anticipate the pair to fluctuate between 1.0378 and 1.0609. The Heiken Ashi indicator's turning downward indicates a new phase of the corrective movement.
Nearest levels of support
S1 – 1.0498
S2 – 1.0376
S3 – 1.0254
Nearest levels of resistance
R1 – 1.0620
R2 – 1.0742
R3 – 1.0864
Trading Suggestions:
The EUR/USD pair is still in an upward trend. So, until the price is fixed below the moving average, new long positions with targets of 1.0742 and 1.0620 should be taken into consideration. No earlier than fixing the price below the moving average line with targets of 1.0376 and 1.0254 will sales become relevant.
Explanations of the illustrations:
Linear regression channels help determine the current trend. The trend is strong if both are directed in the same direction.
The moving average line (settings 20.0, smoothed) – determines the short-term trend and the direction in which trading should be conducted now.
Murray levels are target levels for movements and corrections.
Volatility levels (red lines) are the likely price channel in which the pair will spend the next day, based on current volatility indicators.
The CCI indicator – its entry into the oversold area (below -250) or into the overbought area (above +250) means that a trend reversal in the opposite direction is approaching.
 English
 Русский
 Bahasa Indonesia
 Bahasa Malay
 ไทย
ไทย Español
 Deutsch
 Български
 Français
 Tiếng Việt
 中文
中文 বাংলা
বাংলা हिन्दी
 Čeština
 Українська
 Română

