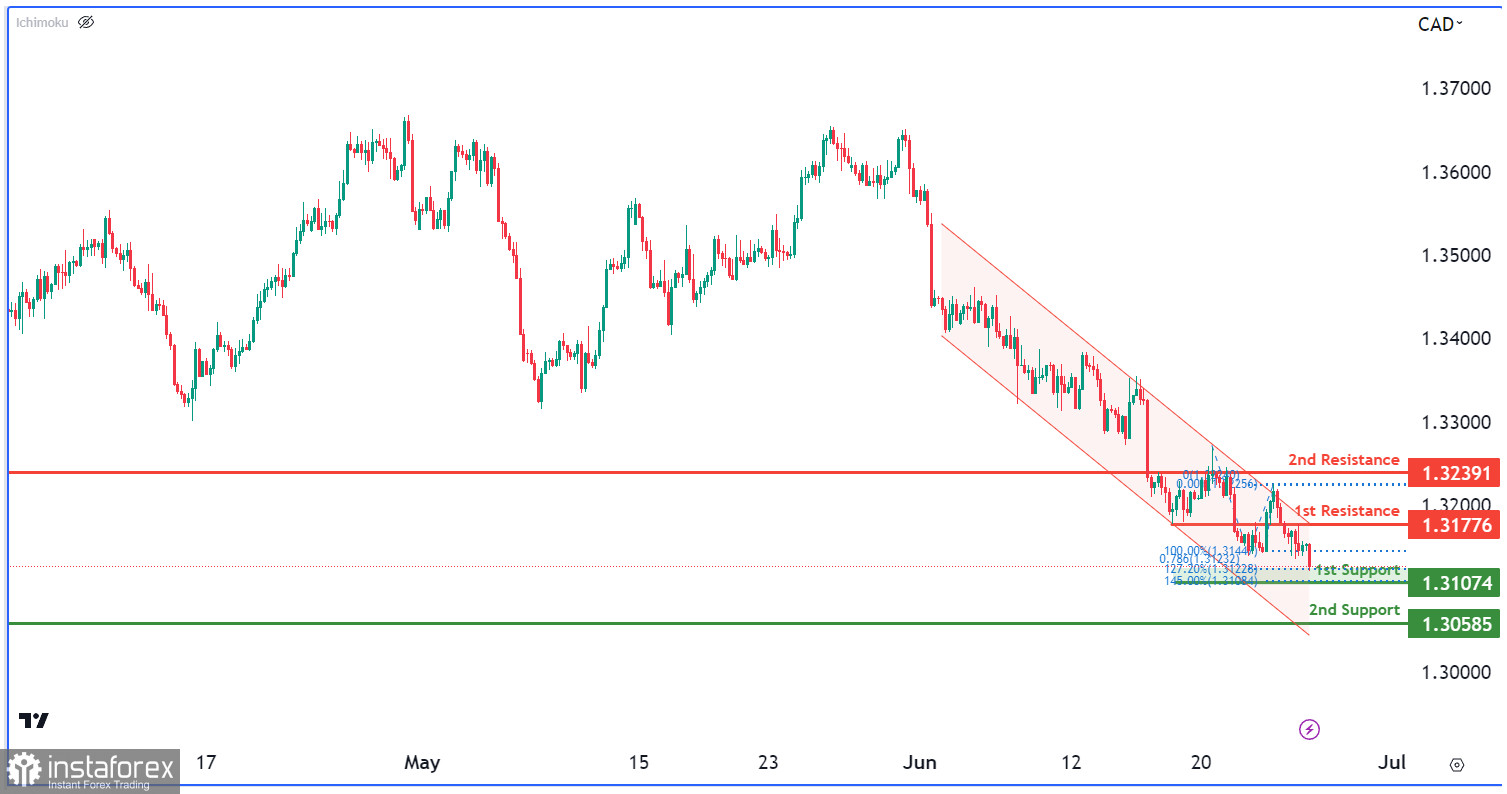
The USD/CAD chart is currently displaying a bearish momentum, characterized by the price movement within a descending channel, indicating a potential for further downward movement.
There is a possibility of a short-term rise towards the 1st resistance level at 1.3177, which serves as an overlap resistance. However, it is expected that the price might reverse off this resistance level and move towards the 1st support level at 1.3107. The confluence of the 127.20% Fibonacci Extension and the 78.60% Fibonacci Projection adds strength to this support level.
Furthermore, the 2nd support level at 1.3058 is identified as a pullback support, contributing to its significance in providing a potential support zone. On the upside, the 2nd resistance level at 1.3239 acts as another overlap resistance, indicating its importance in impeding further upward price movement.
 English
 Русский
 Bahasa Indonesia
 Bahasa Malay
 ไทย
ไทย Español
 Deutsch
 Български
 Français
 Tiếng Việt
 中文
中文 বাংলা
বাংলা हिन्दी
 Čeština
 Українська
 Română

