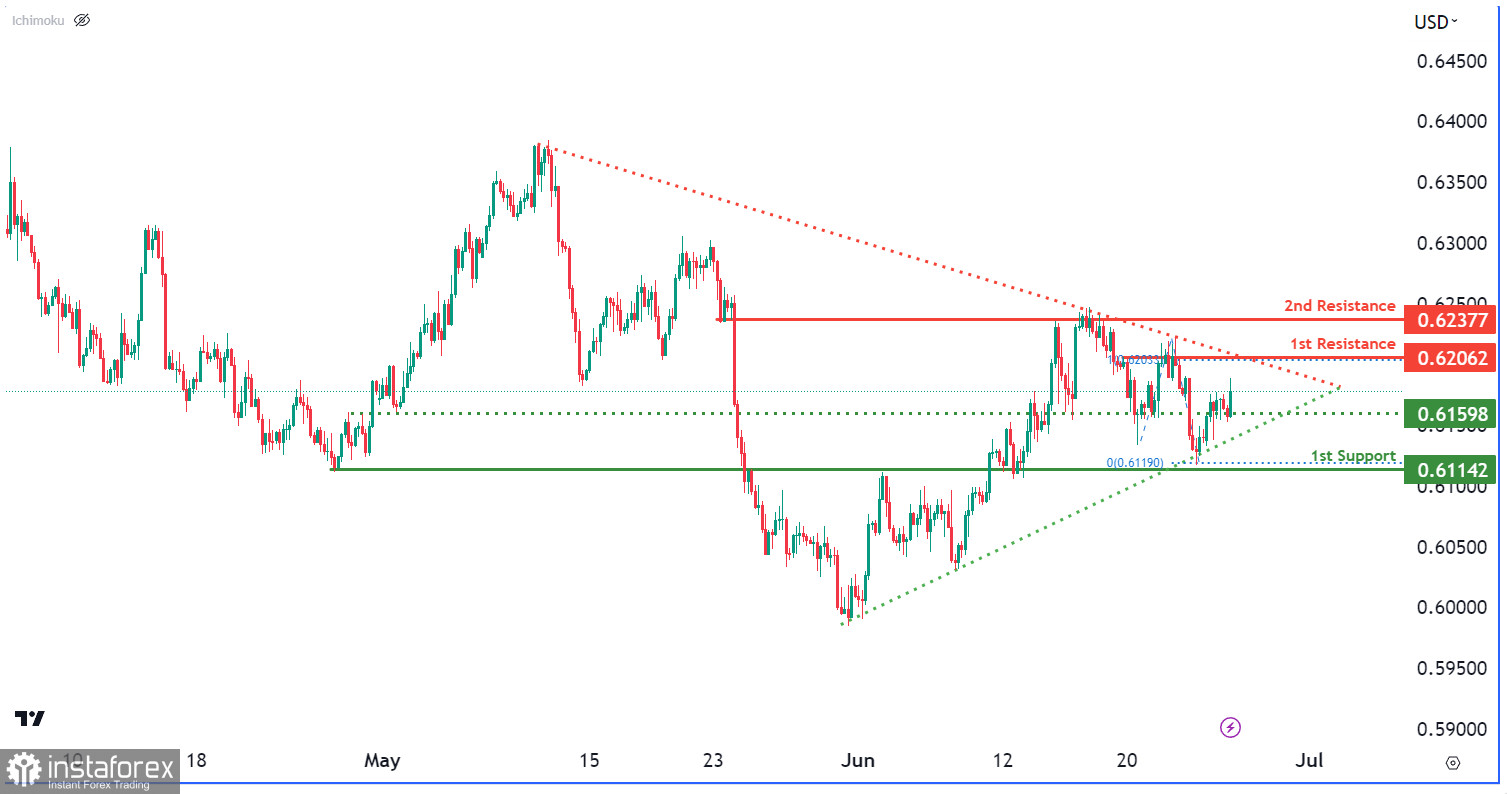
The NZD/USD chart currently shows a neutral momentum, implying a lack of clear market direction. The price is expected to fluctuate between the 1st resistance level at 0.6206 and the 1st support level at 0.6114. The 0.6114 support level is significant as it acts as an important overlap support, providing potential strength to the support zone. Additionally, the presence of an intermediate support level at 0.6159 further reinforces its importance.
On the upside, the 0.6206 resistance level represents a multi-swing high resistance, potentially impeding upward price movement. Furthermore, the 0.6237 resistance level acts as another overlap resistance, adding to its significance.
It is worth noting the presence of a symmetrical triangle chart pattern, indicating a period of consolidation. Breakouts above the upper trendline could suggest a bullish breakout, while breakouts below the lower trendline may indicate a bearish breakdown
 English
 Русский
 Bahasa Indonesia
 Bahasa Malay
 ไทย
ไทย Español
 Deutsch
 Български
 Français
 Tiếng Việt
 中文
中文 বাংলা
বাংলা हिन्दी
 Čeština
 Українська
 Română

