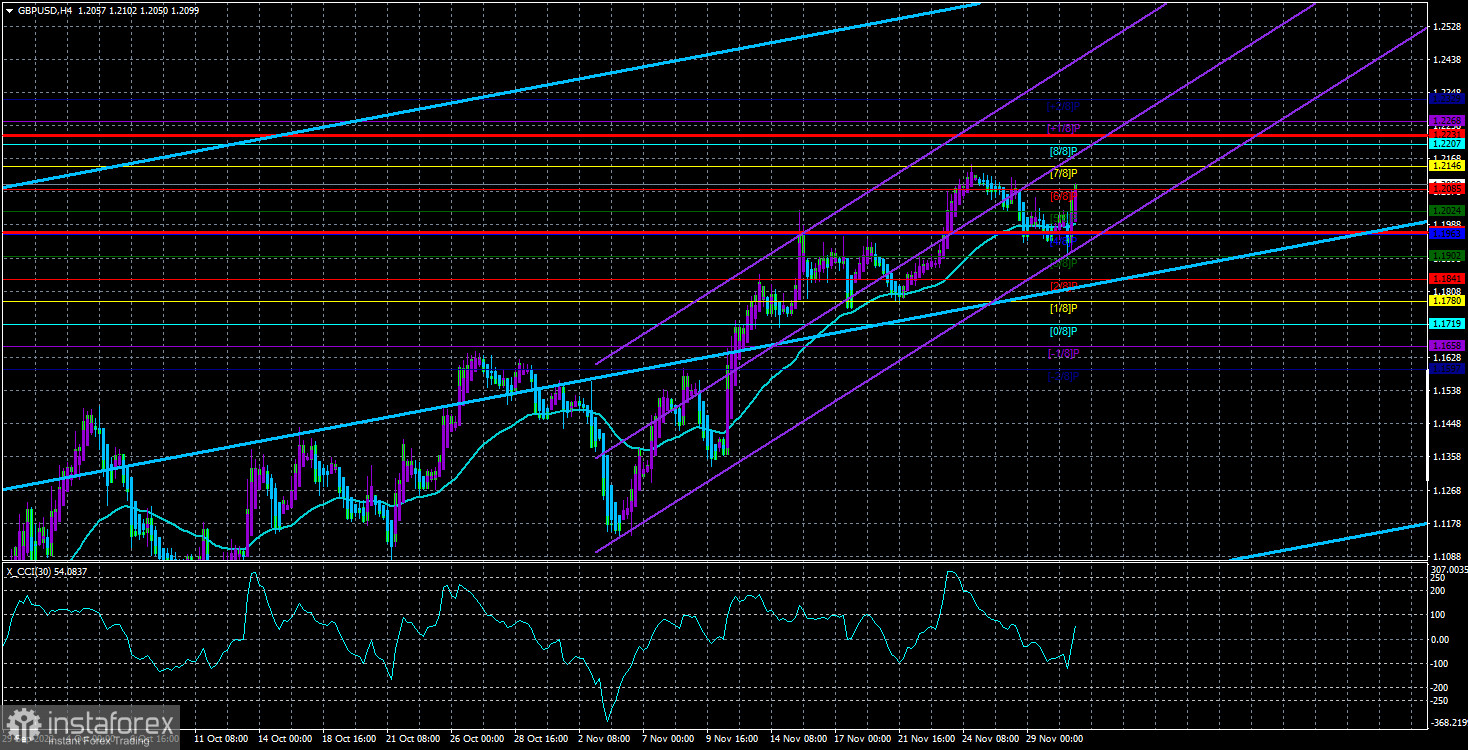
On Wednesday, the GBP/USD currency pair traded as slowly as the euro. The market did not see any reason to trade actively and trendily here either, although there were fewer reports relating to the British pound and the dollar. We can therefore draw the same conclusions about the pound. There is currently no reason to anticipate a downward correction because the price is close to the moving average line, and there has not yet been a clear consolidation below it. However, we continue to think that the pound sterling has risen too much in the last month and that there are no more reasons for it to rise.
As was already stated, there was no response to yesterday's GDP and labor market reports. The "polar" nature of these two reports may be to blame for this outcome. Simply put, the GDP report was very strong, and the ADP report was weak (only 127 thousand versus a forecast of 200). As a result, "netting" prevented us from observing the dollar's rise or decline. However, rather than ignore significant data in such circumstances, the market prefers to trade alternately in both directions. In any case, we received a peculiar response and peculiar bidding. We will have to wait until Friday because there will be a few significant reports on Thursday. We want to remind you that you shouldn't consider the nonfarm report to be "trend-forming." Of course, it matters, but the dollar can quickly fluctuate by 100 to 150 points before resuming its previous positions. As a result, if the market is not prepared to buy the US dollar on Friday, it won't be. This refers to those that will cause the significant downward correction we anticipate.
The ADP report: a sign of trouble for nonfarm?
The number of jobs created outside of agriculture in a single month is roughly the same in both the ADP and NonFarm Payrolls reports. ISM and S&P business activity reports are comparable. And they hardly ever coincide with one another, just like business activity indices. They frequently differ in their forecasts and actual values, which are frequently revised later. As a result, one should always approach these data assuming that the values may change in a month. First, the ADP report showed a very small increase in employment—only 127 thousand. As previously stated, a normal value for the American economy is between 200 and 300,000. Although both indicators have not displayed the same dynamics over the past year, the market places a higher value on nonfarm.
Until April 2022, the ADP report grew steadily before declining. With some exceptions, nonfarm rates have been falling for a year. Therefore, it is unquestionably false to infer that nonfarm will also be weak due to ADP's failure. Additionally, Nonfarm has experienced negative dynamics, so we fully anticipate that this report will reveal a lower value than a month ago (261 thousand). But the value from last month might have changed, so it's impossible to say for sure right now. All of this was written so traders would understand that the actual value could be anything, the value from the previous month could change in any direction, and the market could interpret this report however it saw fit. It is, therefore, impossible to forecast where the dollar will move on Friday at this time. Of course, volatility is likely to rise, and we still anticipate that the pair will decline. To understand where the pair may move in the future, we advise waiting several days for either a clear and confident overcoming of the moving average or a clear and confident rebound from it.

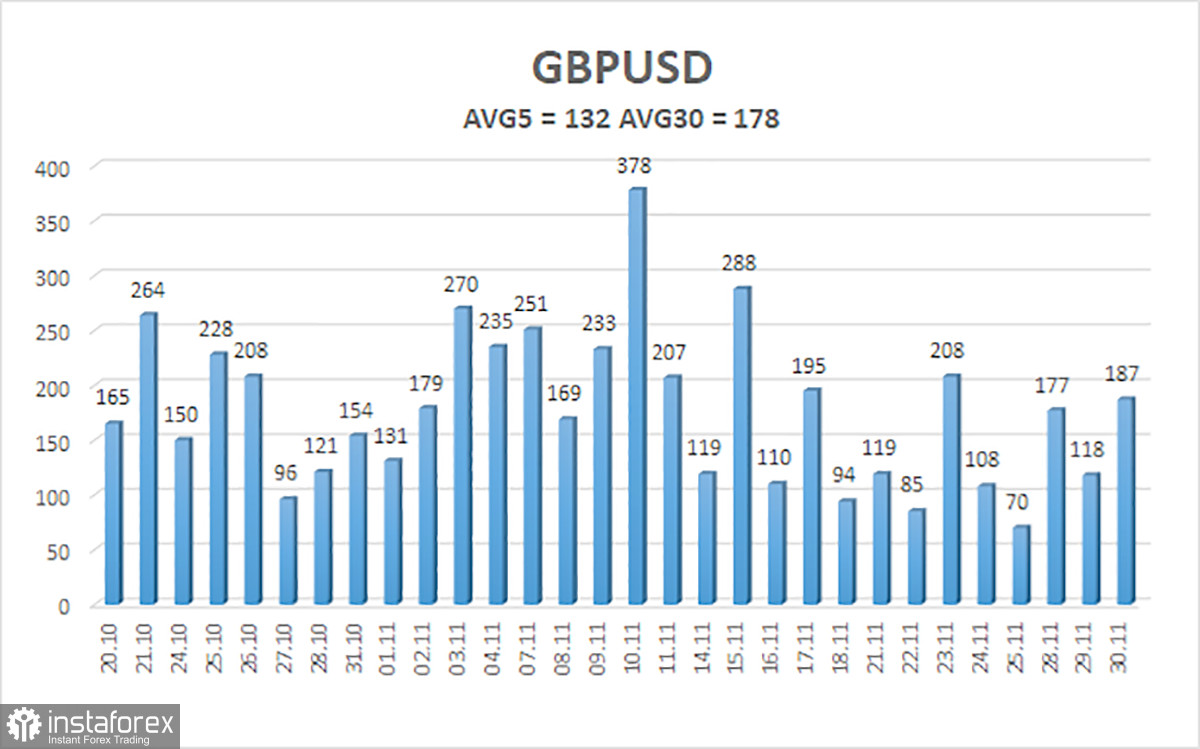
Over the previous five trading days, the GBP/USD pair has averaged 132 points of volatility. This value is "high" for the dollar/pound exchange rate. As a result, we anticipate movement on Thursday, December 1, within the channel, constrained by the levels of 1.1968 and 1.2231. The Heiken Ashi indicator's turning downward indicates a new phase of the corrective movement.
Nearest levels of support
S1 – 1.2024
S2 – 1.1963
S3 – 1.1902
Nearest levels of resistance
R1 – 1.2085
R2 – 1.2146
R3 – 1.2207
Trading Suggestions:
In the 4-hour timeframe, the GBP/USD pair resumed its upward trend. Therefore, until the Heiken Ashi indicator turns down, you should continue holding buy orders with targets of 1,2207 and 1,2231. With targets of 1.1841 and 1.1780, open sell orders should be fixed below the moving average.
Explanations of the illustrations:
Linear regression channels – help determine the current trend. The trend is strong if both are directed in the same direction.
The moving average line (settings 20.0, smoothed) – determines the short-term trend and the direction to trade now.
Murray levels are target levels for movements and corrections.
Volatility levels (red lines) are the likely price channel in which the pair will spend the next day, based on current volatility indicators.
The CCI indicator – its entry into the oversold area (below -250) or into the overbought area (above +250) means that a trend reversal in the opposite direction is approaching.
 English
 Русский
 Bahasa Indonesia
 Bahasa Malay
 ไทย
ไทย Español
 Deutsch
 Български
 Français
 Tiếng Việt
 中文
中文 বাংলা
বাংলা हिन्दी
 Čeština
 Українська
 Română

