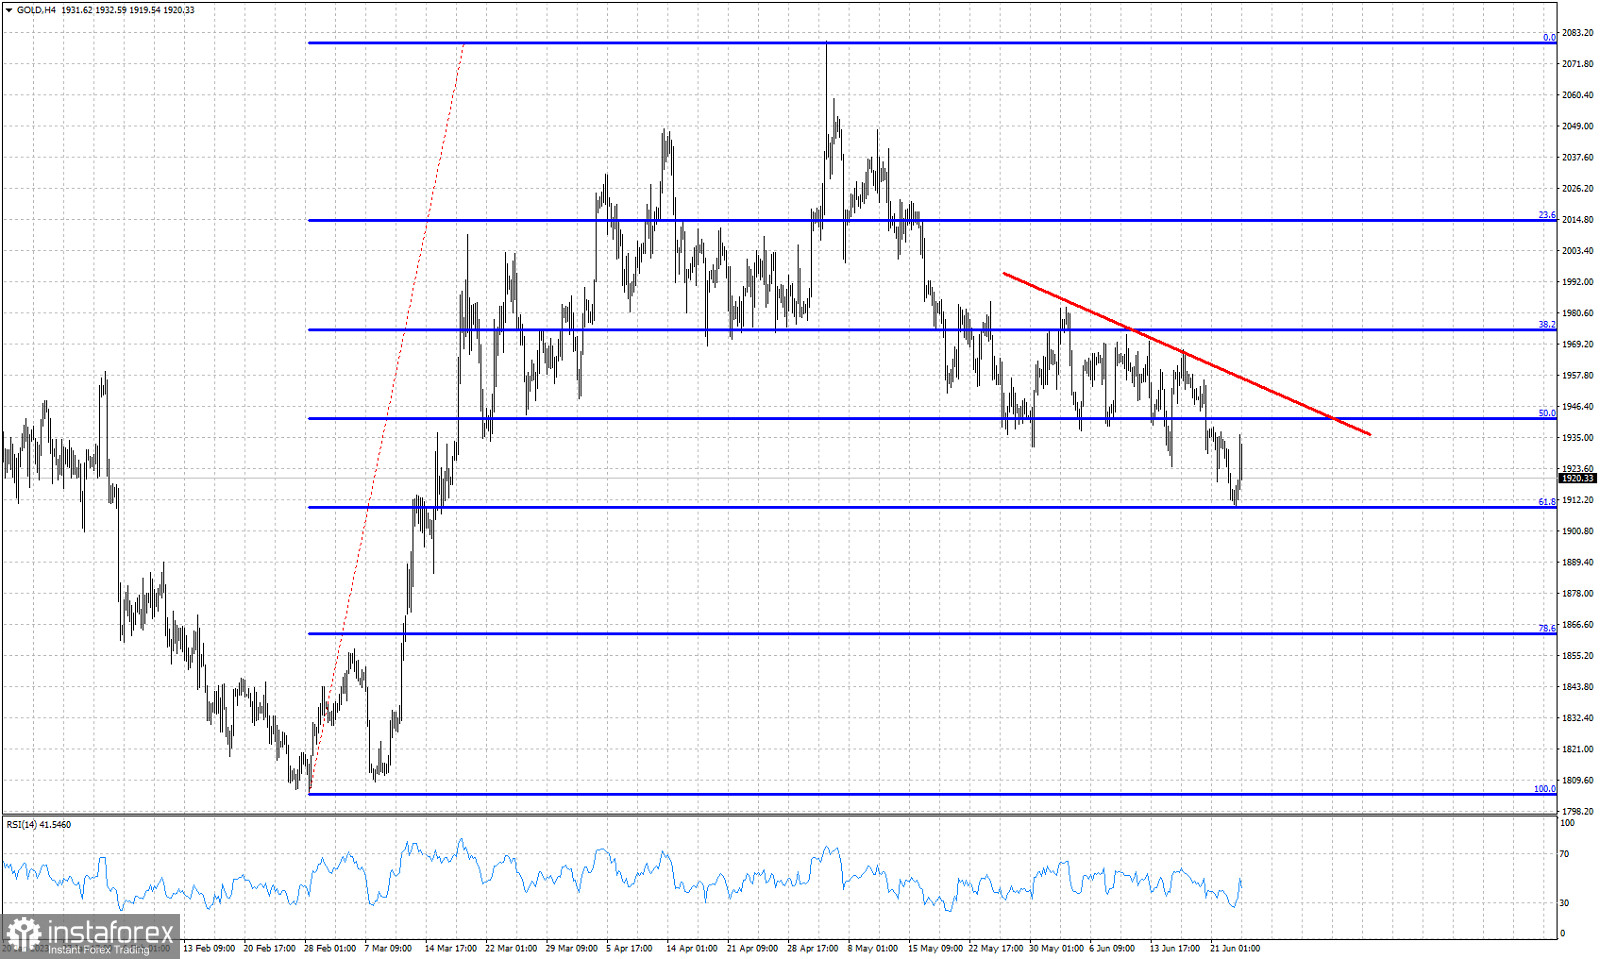
Blue lines- Fibonacci retracement levels
Red line- resistance trend line
Gold price is trading just above $1,910. Price made a low at $1,909 where we find the 61.8% Fibonacci retracement of the upward movement from $1,804. Short-term trend remains bearish as Gold continues forming lower lows and lower highs. Gold price is bouncing off the 61.8% Fibonacci support. The 61.8% retracement level is where we usually see trend reversals. Resistance is found at the red trend line at $1,955. As long as price is below the red trend line, short-term trend remains bearish. Support remains at the recent low just above $1,908. If the 61.8% retracement fails to hold, we should expect price to move lower towards the 78.6% retracement at $1,862.
 English
 Русский
 Bahasa Indonesia
 Bahasa Malay
 ไทย
ไทย Español
 Deutsch
 Български
 Français
 Tiếng Việt
 中文
中文 বাংলা
বাংলা हिन्दी
 Čeština
 Українська
 Română

