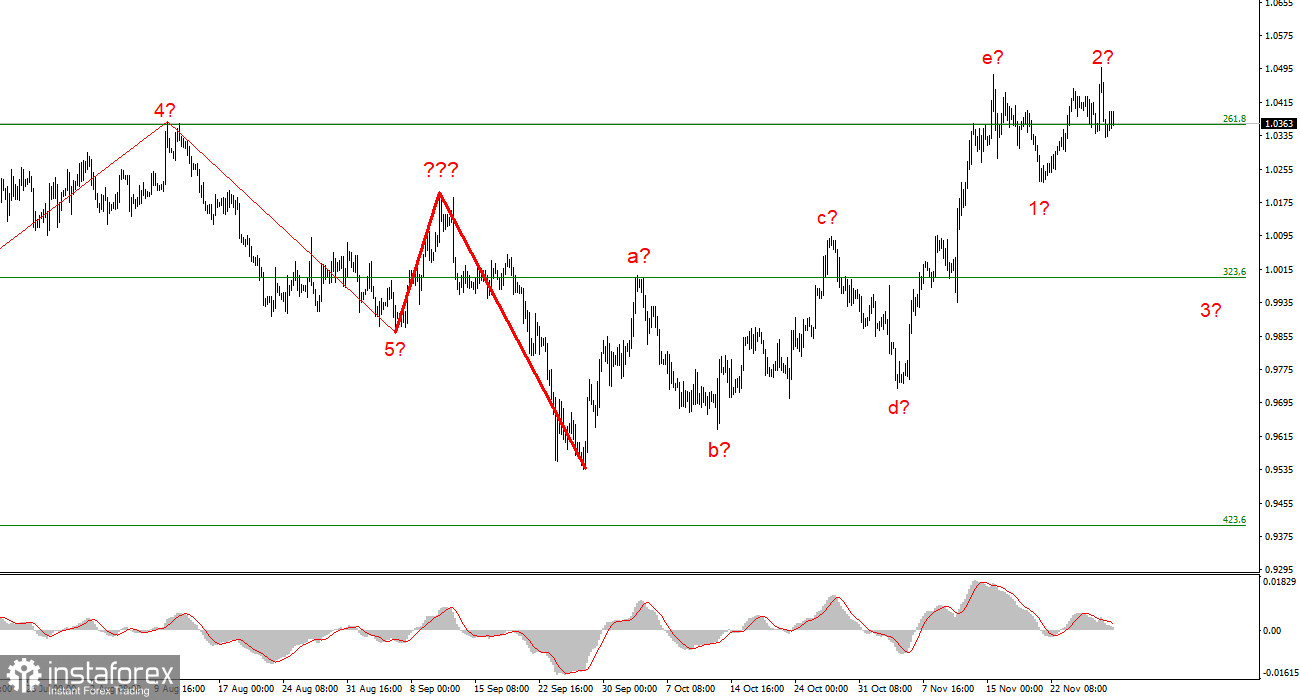
Although it still looks very convincing, the wave marking on the 4-hour chart for the euro/dollar instrument needs to be adjusted. The upward portion of the trend has corrected itself. A-b-c-d-e waves have a complex correction structure that we have discovered. Since the peak of wave e exceeds the peak of wave C, if the current wave layout is accurate, construction on this structure may be nearly finished or already be finished. In this instance, it is anticipated that we will construct at least three waves downward, but if the most recent phase of the trend is corrective, the subsequent phase will probably be impulsive. Therefore, I am preparing for a new, significant decline in the instrument. The market will be ready to sell when a new attempt to breach the 1.0359 level, which corresponds to 261.8% Fibonacci, is successful. The wave e may end up being longer overall, and the instrument's most recent decline is not the first wave of a new descending section, as evidenced by the quotes' withdrawal from the lows reached last week and on Monday. However, the alleged wave 2 or b might still exist because it only punctured the wave e's peak. Because there isn't an increase in demand for US currency, the wave pattern is generally starting to become muddled.
There was no response to the first significant report of the week.
On Wednesday, the euro/dollar instrument increased by 40 basis points, but given the news context of the day, this is essentially nothing for this instrument. Even though, at the time of writing, only one of several significant reports had been made public, I still anticipated more activity in the morning. The market has thus far demonstrated that it is uninterested in European inflation. And it would be okay if the report turned out to be uninteresting, but the consumer price index slowed down for the first time in a long time, and it did so quickly. From the 10.6% recorded in October, inflation dropped to a very significant 10.0% in November. I'd like to know whether these rates will persist in the future, but the ECB did well when it increased the rate three times by 2%. Even 2% was enough to slow inflation, though it is still lower than the Fed or the Bank of England rates.
But at the same time, I'd like to remind you that in May, inflation in the US also decreased for a month before starting to rise again. The same pattern was also seen in the UK a few months ago. In other words, a single slowdown in inflation is not particularly significant and could be an accident. That could be why the market did not respond to this report. Skepticism about the future of rising prices may also be influenced by the fact that core inflation did not decline in November and remained at about 5%. Thus, the report appeared to have a lot of value at first glance, but upon closer inspection, most of its "advantages" vanished.

Conclusions in general
The upward trend section's construction is complete and has increased complexity to five waves. As a result, I suggest making sales with targets close to the estimated 0.9994 level, or 323.6% Fibonacci. There is a chance that the upward section of the trend will become more complicated and take on an extended form, but this chance is currently at most 10%.
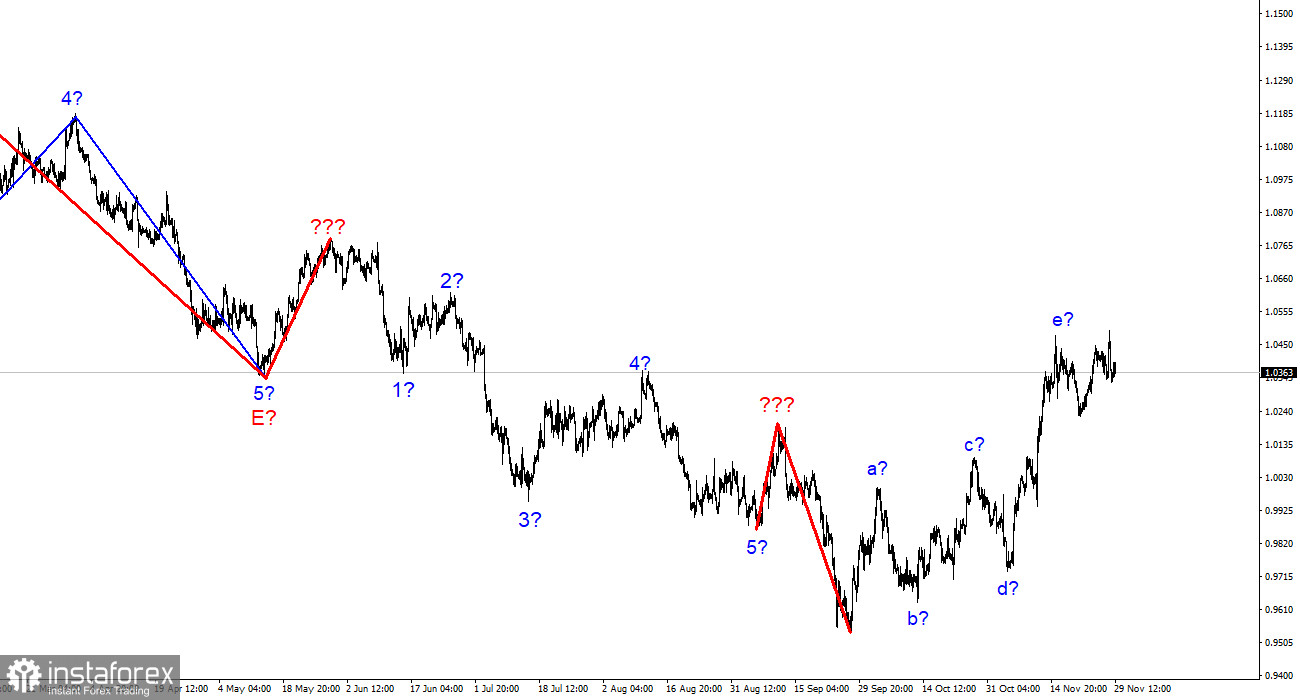
The wave marking of the descending trend segment becomes more intricate and lengthens at the higher wave scale. The a-b-c-d-e structure is most likely represented by the five upward waves we observed. After this section is completed, work on a downward trend section may resume.
 English
 Русский
 Bahasa Indonesia
 Bahasa Malay
 ไทย
ไทย Español
 Deutsch
 Български
 Français
 Tiếng Việt
 中文
中文 বাংলা
বাংলা हिन्दी
 Čeština
 Українська
 Română

