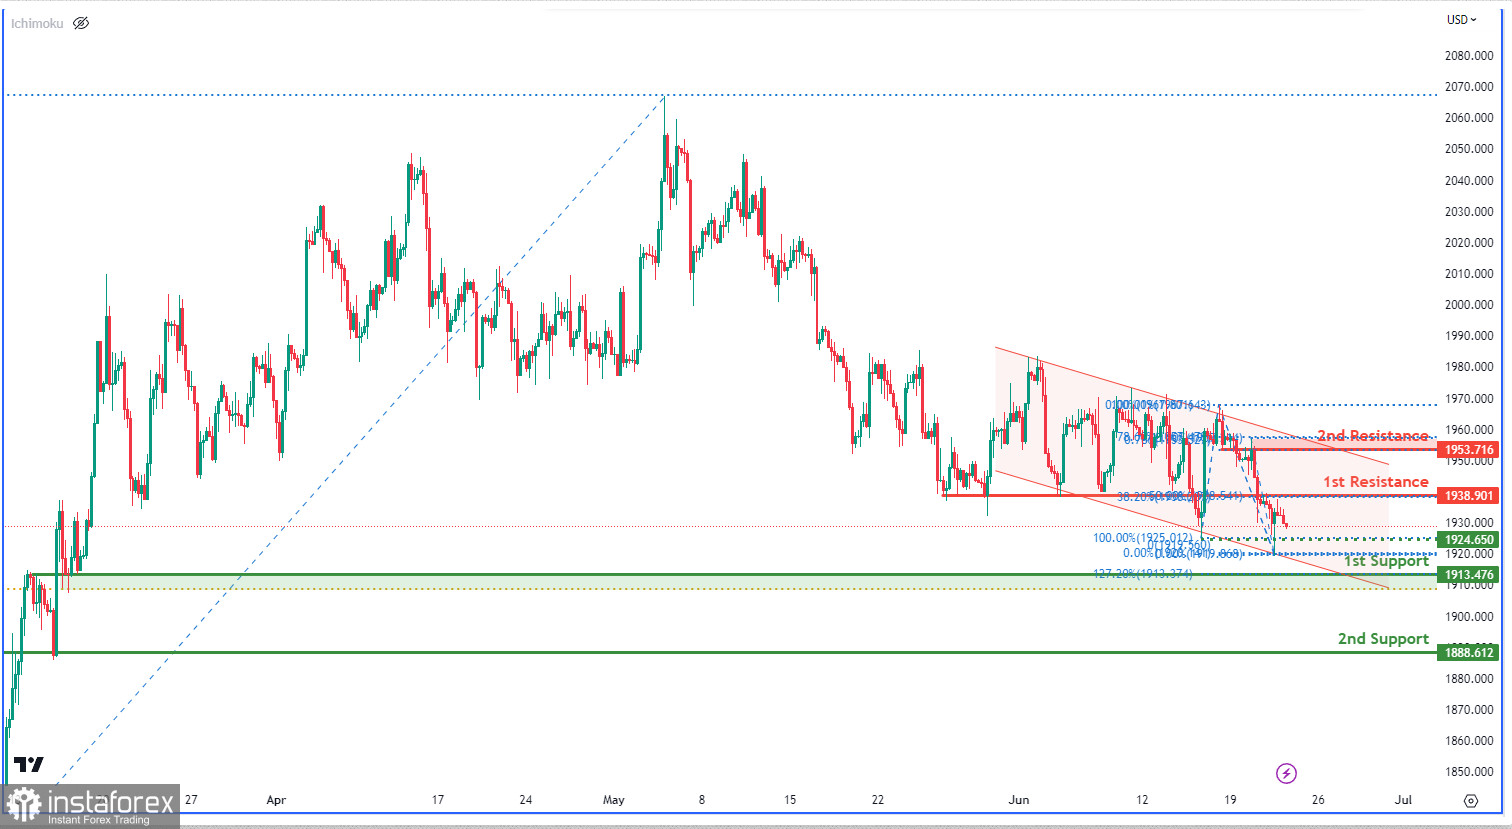
The XAU/USD chart demonstrates a bearish momentum characterised by a descending channel. There is a possibility of a bearish reaction at the first resistance level of 1938.90, which aligns with Fibonacci retracement levels and serves as an overlap resistance. Similarly, the second resistance level at 1953.71 also acts as an overlap resistance, coinciding with Fibonacci retracement and projection levels.
On the downside, the first support level at 1913.47 is an identified overlap support, encompassing Fibonacci extension and retracement levels. Additionally, the second support level at 1888.61 provides another overlap support. Furthermore, an intermediate support at 1924.65 is recognized as a pullback support.
 English
 Русский
 Bahasa Indonesia
 Bahasa Malay
 ไทย
ไทย Español
 Deutsch
 Български
 Français
 Tiếng Việt
 中文
中文 বাংলা
বাংলা हिन्दी
 Čeština
 Українська
 Română

