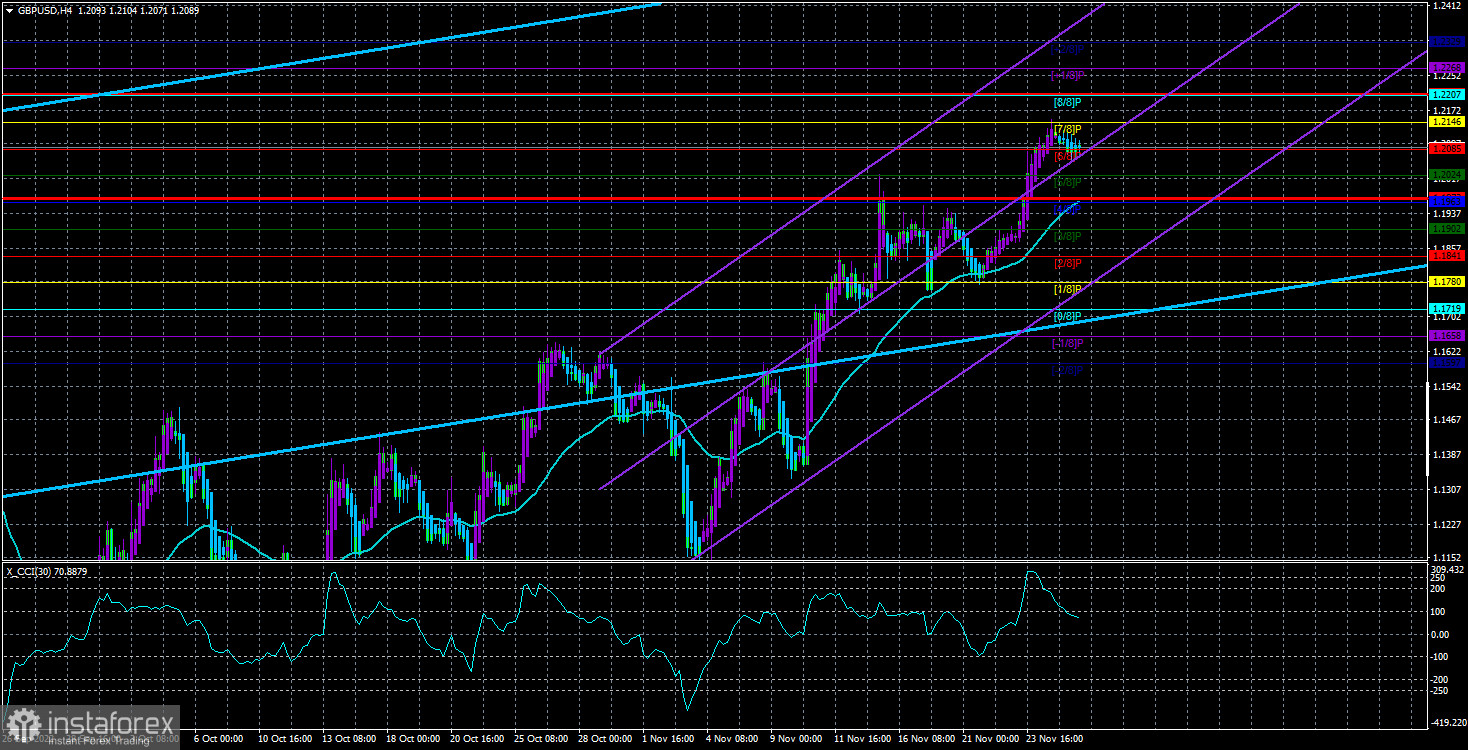
The GBP/USD currency pair finished the previous trading week with only a slight downward pullback. The British pound's growth has been a topic of discussion for the previous week, though it is not entirely unfounded. Recall that Scotland had asked to hold a referendum without London's formal approval, but the UK Supreme Court denied it. This information means there won't be a referendum anytime soon, saving the Kingdom from losing a significant portion of its territory and economy. This factor is very important, so traders could buy the pound based on it. Additionally, all technical factors are in unison favor of the upward movement. On the 24-hour TF, the price is above all of the Ichimoku indicator's lines and is situated above the moving average line. Additionally, both linear regression channels point upward. However, the growth over the last three weeks has raised some concerns because it has been too quick. We are not opposed to the pound's quotes rising further, but we think there should be a correction. Last week, we were expecting her, but the Supreme Court "ruined" everything.
Also to be considered is the possibility of a strengthening of the pound due to inflation. Inflation also occurs globally, not just in the US or the UK. Inflation is still rising in Britain even though it has been slowing down in the US for a while. Therefore, growth rates in America may start to slow down, whereas they may (theoretically) continue to grow strongly and for a long time in the UK. This element can help the pound sterling, just as it did for the euro. Inflation in Britain is unlikely to begin to decline this month, even if it does in Europe.
The focus is solely on non-farm payrolls.
There won't be many noteworthy activities or publications in the UK this coming week. We can only single out a few speeches by Bank of England representatives that were spread out throughout the week, along with the Thursday release of the manufacturing sector's most important business activity index. There won't be much for traders to focus on.
The United States is a different situation. Their calendar will also be empty for the first half of the week. The second estimate of GDP for the third quarter and the ADP report on changes in the number of employees in the private sector will be released on Wednesday, marking the beginning of everything. We should immediately state that we do not anticipate any of these reports to elicit a strong response. This is only the second estimate of GDP, which is not likely to differ significantly from the first estimate, and the ADP report rarely causes significant changes in the dollar. However, these reports might be intriguing from the perspective of comprehending the present state of the American economy. Jerome Powell will also speak on the same day, and his "pre-election" rhetoric can potentially boost or destabilize the market.
Both significant data on the personal income and expenses of the American population as well as an important ISM business activity index for the manufacturing sector will be released on Thursday, December 1. The unemployment rate, non-farm payrolls, and average hourly wages will all be released on Friday. Non-Farm Payrolls are undoubtedly the most important report of the entire week. Experts predict it will be worth between $200 and $210 thousand in November, which may seem insignificant to traders. This is partially true—the indicator has been slowing for several months—but keep in mind that this slowdown occurred when the US economy rapidly recovered from the pandemic. From looking at Nonfarm values before the pandemic, it is clear that the normal value is only 200–300 thousand per month. What matters more is whether the forecast and the value will match. The US dollar may decline significantly if, for instance, we observe +100-150 thousand. It will become significantly stronger if it exceeds 230–240 thousand. As you can see, this week will be quite busy with significant events.

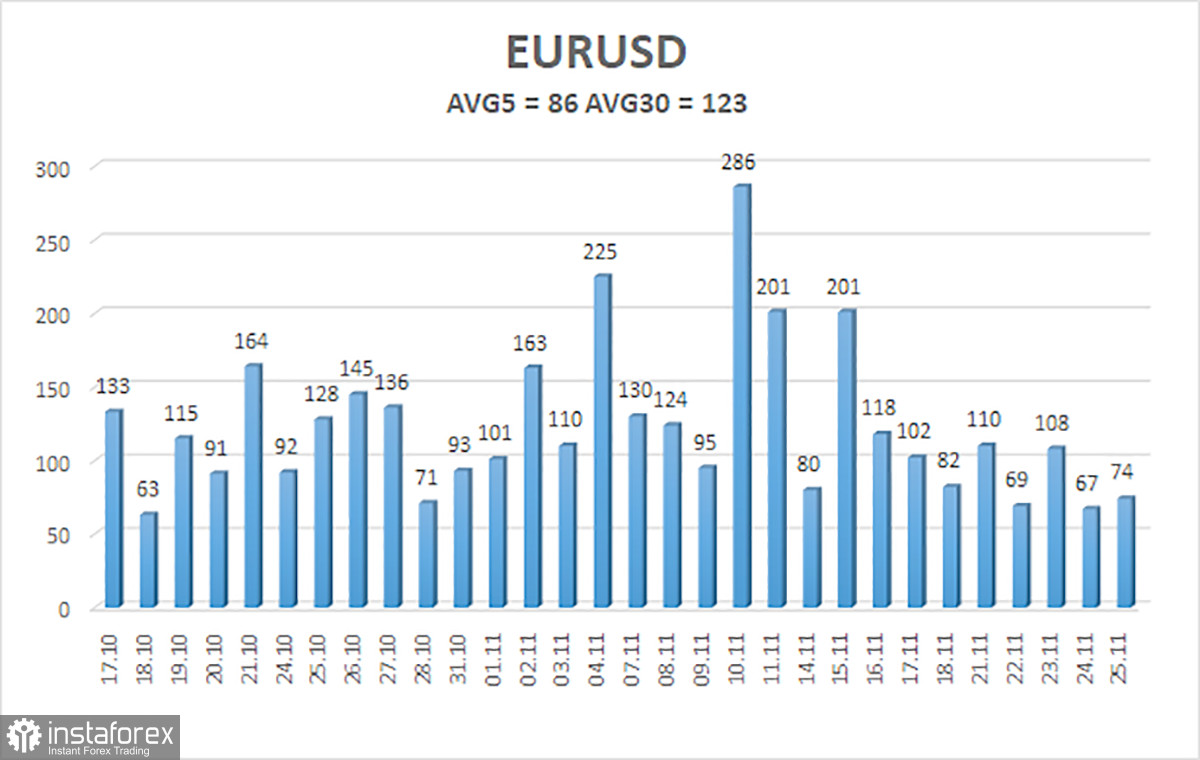
Over the previous five trading days, the GBP/USD pair has averaged 118 points of volatility. This value is "high" for the dollar/pound exchange rate. Thus, we anticipate movement inside the channel on Monday, November 28, with movement being constrained by levels of 1.1972 and 1.2209. The Heiken Ashi indicator's upward reversal indicates that the upward movement has resumed.
Nearest levels of support
S1 – 1.2085
S2 – 1.2024
S3 – 1.1963
Nearest levels of resistance
R1 – 1.2146
R2 – 1.2207
R3 – 1.2268
Trading Suggestions:
On the 4-hour timeframe, the GBP/USD pair has begun a minor correction. Therefore, at this time, new buy orders with targets of 1.2146 and 1.2207 should be taken into account if the Heiken Ashi indicator reverses to the upside. When a price is anchored below the moving average, sell orders should be placed with targets of 1.1902 and 1.1841.
Explanations to the illustrations:
Linear regression channels – help determine the current trend. The trend is strong if both are directed in the same direction.
Moving average line (settings 20.0, smoothed) – determines the short-term trend and the direction in which trading should be conducted now.
Murray levels – target levels for movements and corrections.
Volatility levels (red lines) – the likely price channel in which the pair will spend the next day, based on current volatility indicators.
The CCI indicator – its entry into the oversold area (below -250) or into the overbought area (above +250) means that a trend reversal in the opposite direction is approaching.
 English
 Русский
 Bahasa Indonesia
 Bahasa Malay
 ไทย
ไทย Español
 Deutsch
 Български
 Français
 Tiếng Việt
 中文
中文 বাংলা
বাংলা हिन्दी
 Čeština
 Українська
 Română

