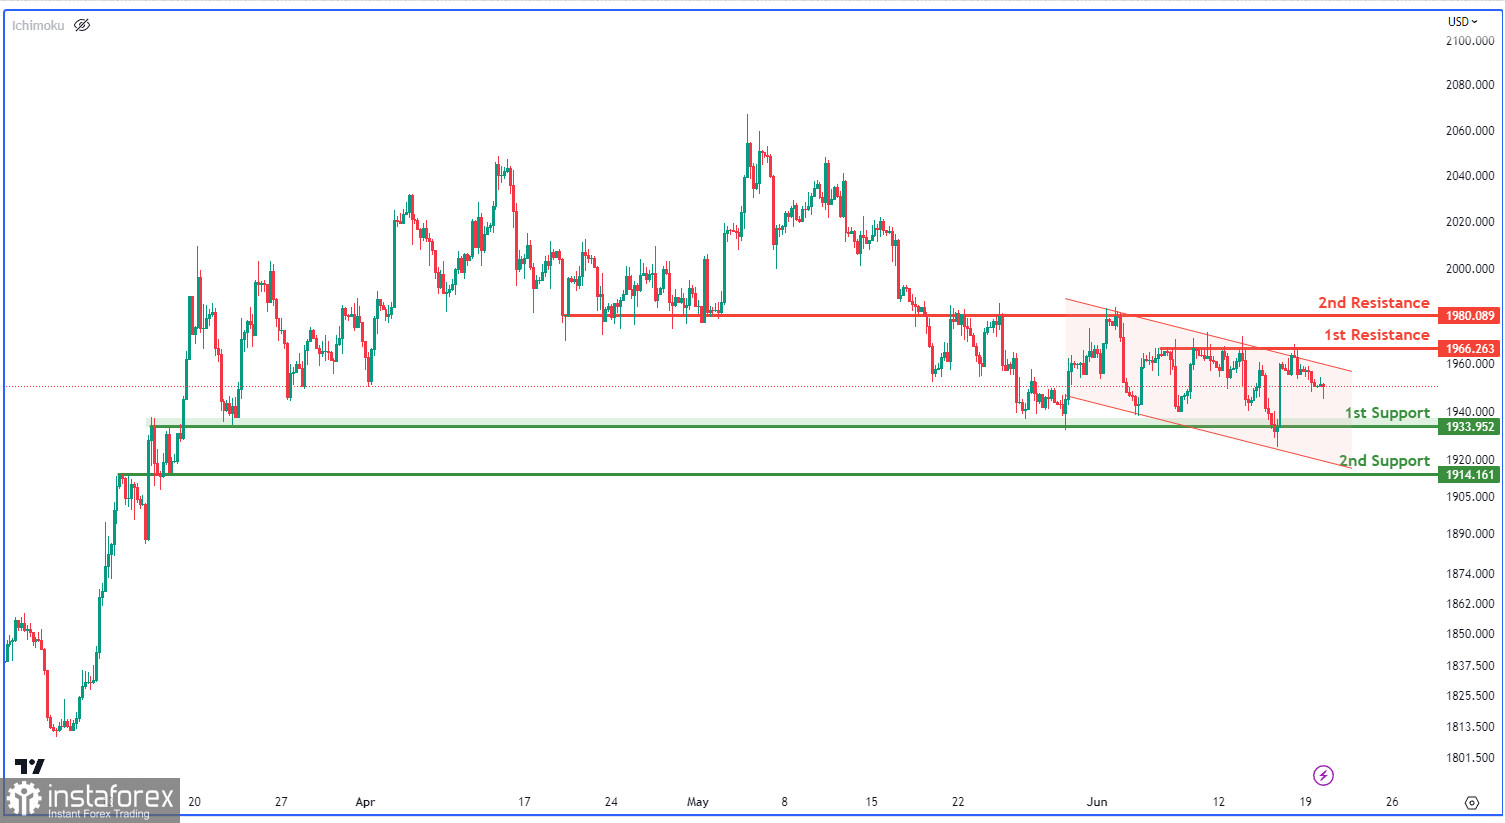
The XAU/USD chart shows a bearish momentum, indicating a downtrend in the market as evidenced by the price movement within a bearish descending channel.
Potential bearish continuation is expected towards the first support level at 1933.95, which acts as an overlap support. The second support level at 1914.16 further reinforces this bearish scenario.
Conversely, on the upside, the first resistance level at 1966.26 represents a significant multi-swing high resistance. Additionally, the second resistance level at 1980.08 is identified as an overlap resistance.
 English
 Русский
 Bahasa Indonesia
 Bahasa Malay
 ไทย
ไทย Español
 Deutsch
 Български
 Français
 Tiếng Việt
 中文
中文 বাংলা
বাংলা हिन्दी
 Čeština
 Українська
 Română

