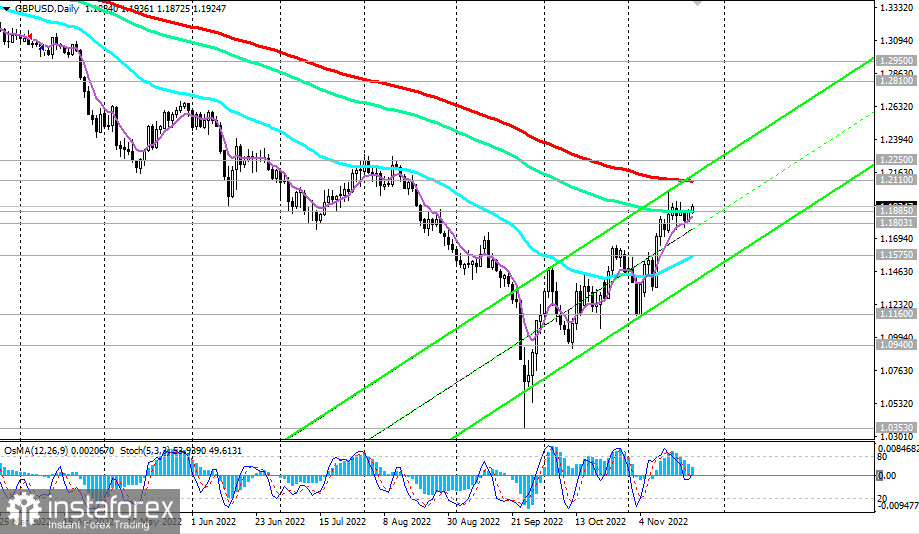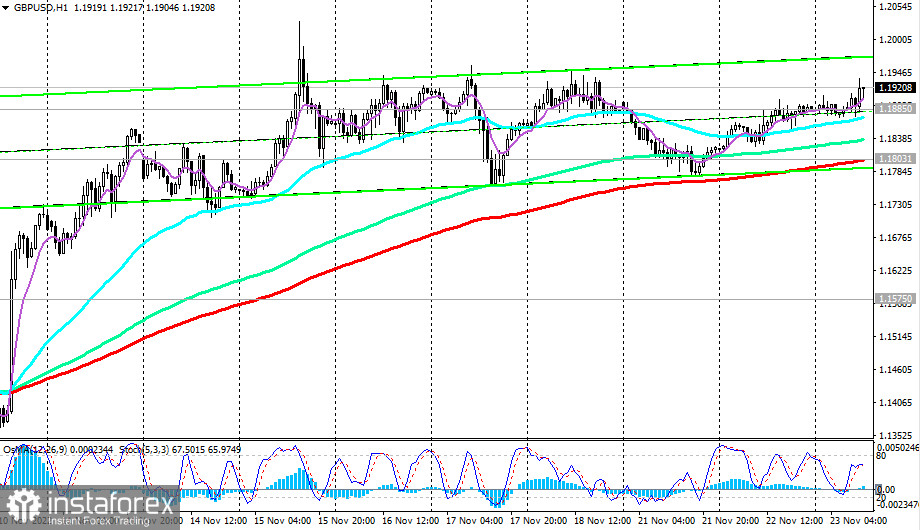
As of writing, GBP/USD is trading near 1.1920, trying to hold above the long-term support level of 1.1885 (144 EMA on the daily chart).
GBP/USD has been developing an upward trend since late September, taking advantage of both the dollar weakness and the measures taken by the Bank of England to support the market of British government bonds.
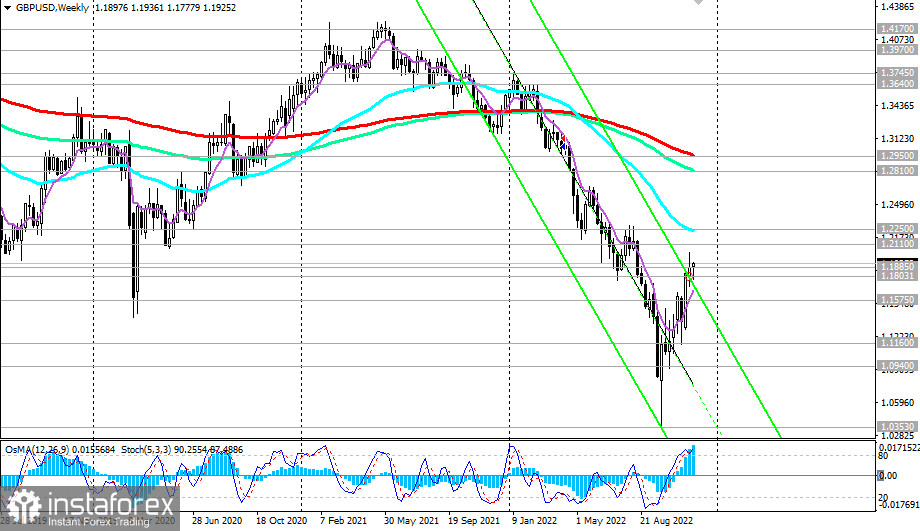
Since the multi-year low of 1.0353 hit on September 26, the pair is up 15% (or almost 1,570 pips) and is still in an upward trend in the medium term, moving inside the upward trend channel on the daily chart. Its upper boundary is near 1.2110, which is also a key resistance level (200 EMA on the daily chart). Given that GBP/USD remains in the long-term bear market zone below this resistance level, we should expect a pullback near it and a return to the downward trend.

However, the rebound might occur near the resistance level of 1.1885 if large buyers of the dollar decide to move its quotes higher, which will also be accompanied by the harsh rhetoric of the statements of the Fed leadership about the prospects of the monetary policy. Today, at 19:00 GMT, the minutes of the Fed's November meeting will be published, which may contain additional information regarding the prospects for the US central bank's monetary policy. It is worth considering this fact very carefully.

Below resistance levels 1.1885, 1.2110, GBP/USD remains in the long-term bear market zone, which makes short positions preferable. After the breakdown of support at 1.1885, an additional signal to enter short positions will be a breakdown of the important short-term support level of 1.1803 (200 EMA on the 1-hour chart).
Support levels: 1.1885, 1.1803, 1.1575, 1.1500, 1.1400, 1.1300, 1.1200, 1.1160, 1.0940
Resistance levels: 1.2000, 1.2110, 1.2250
Trading Tips
Sell Stop 1.1870. Stop-Loss 1.1960. Take-Profit 1.1803, 1.1575, 1.1500, 1.1400, 1.1300, 1.1200, 1.1160, 1.0940
Buy Stop 1.1960. Stop-Loss 1.1870. Take-Profit 1.2000, 1.2110, 1.2250
 English
 Русский
 Bahasa Indonesia
 Bahasa Malay
 ไทย
ไทย Español
 Deutsch
 Български
 Français
 Tiếng Việt
 中文
中文 বাংলা
বাংলা हिन्दी
 Čeština
 Українська
 Română

