Technical Market Outlook:
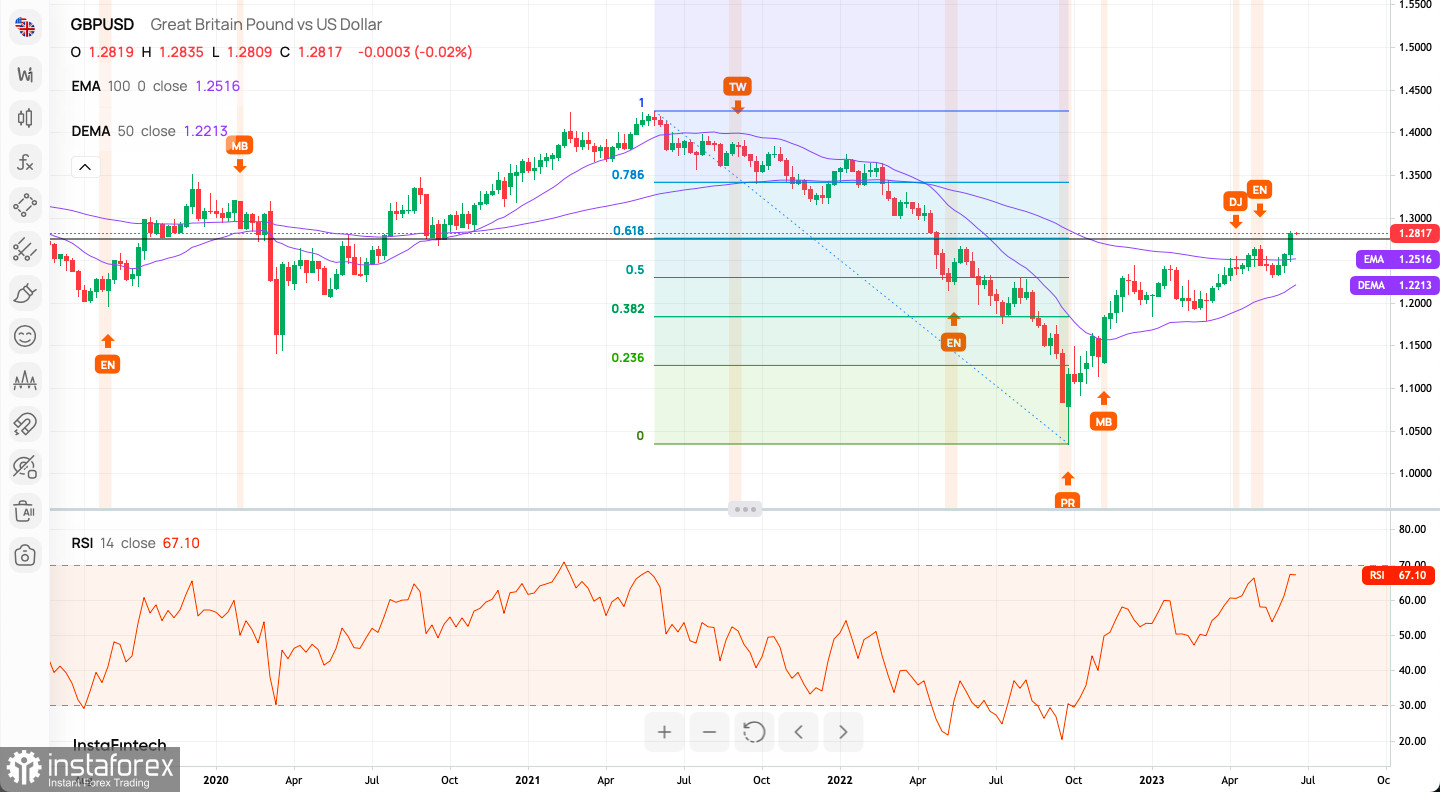
The GBP/USD pair has hit 61% Fibonacci retracement level on the weekly time frame chart located at 1.2778. This is the line in sand for bears as any breakout higher would be considered even more bullish. So far the monthly high was made at the level of 1.2847, but it does not mean it will hold all week. On the lower time frames, like H4, the intraday technical support is seen at the level of 1.2809 and 1.2767. The strong and positive momentum on the H4 time frame chart supports the short-term bullish outlook for GBP, but due to the extremely overbought market conditions on the H4 time frame chart, the market might pull- back soon.

Weekly Pivot Points:
WR3 - 1.28745
WR2 - 1.28480
WR1 - 1.28330
Weekly Pivot - 1.28215
WS1 - 1.28065
WS2 - 1.27950
WS3 - 1.27685
Trading Outlook:
The 61% Fibonacci retracement located at the level of 1.2778 has been hit, but it does not indicate the corrective cycle to the upside had been terminated. Any sustained breakout above this level and a weekly candle close above it is needed to change the long-term outlook to bullish. The key long term level of technical support is seen at 1.2444. The next long-term target for bulls is seen at the level of 1.3160.
 English
 Русский
 Bahasa Indonesia
 Bahasa Malay
 ไทย
ไทย Español
 Deutsch
 Български
 Français
 Tiếng Việt
 中文
中文 বাংলা
বাংলা हिन्दी
 Čeština
 Українська
 Română

