Economic calendar on November 21
The economic calendar is commonly empty on Monday. It is true of the EU, the UK, and the US today. Therefore, investors and traders will take into account the information environment.
Overview of technical charts of November 21
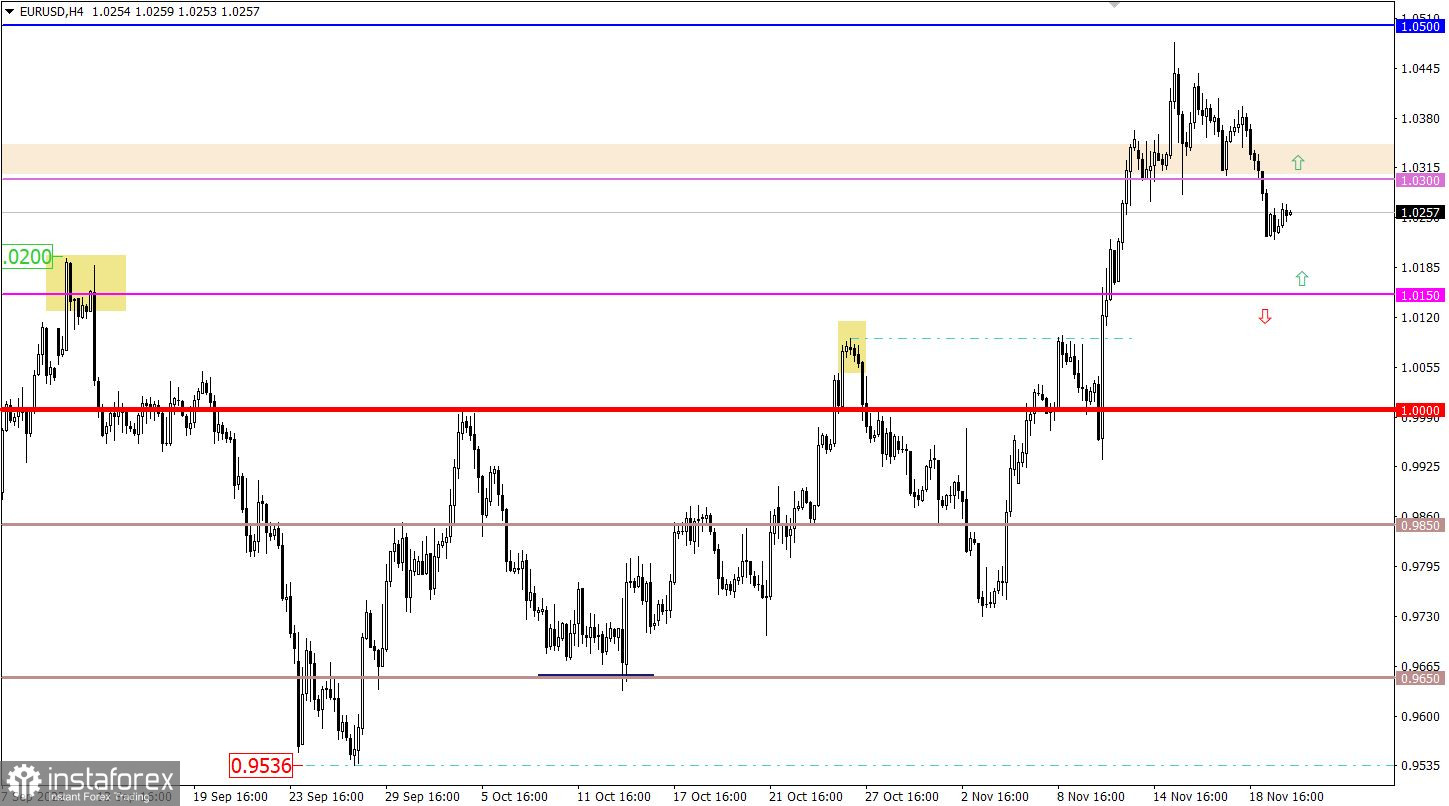
EUR/USD opened a new trading week lower. As a result, the price broke the level of 1.0300. In consequence, the euro, which was overbought a few days ago, entered a correction stage.
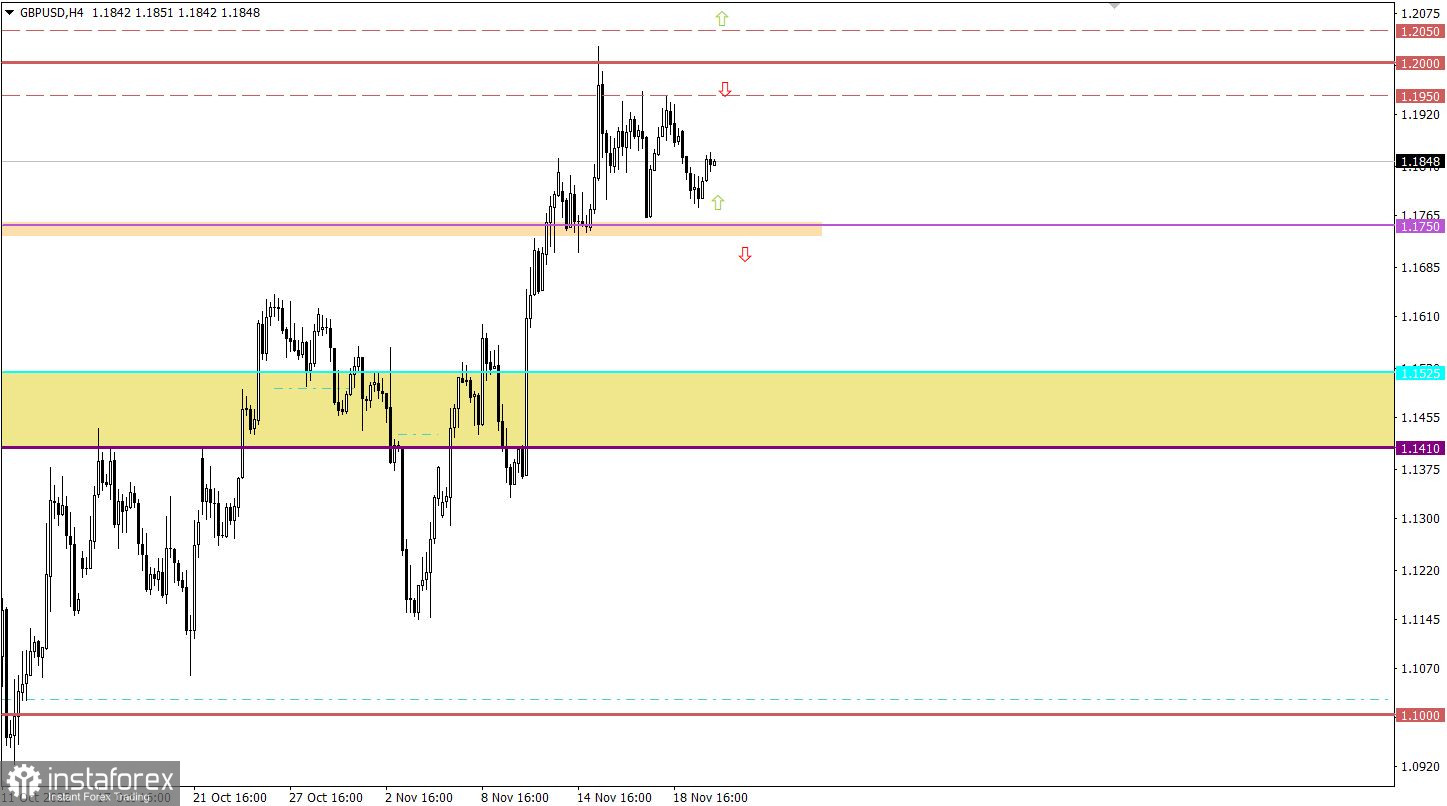
GBP/USD has got trapped sideways, having completed a correctional move from the level of 1.2000. For the time being, the currency pair has been trading within clearly defined borders between 1.1750 and 1.1950 for a week.
Economic calendar on November 22
The economic calendar remains empty on Tuesday. So, traders and investors again are shifting focus towards the news stream.

Trading plan for EUR/USD on November 22
In case the currency pair continues its correctional move, the price could decline to 1.0150. This level could serve as support that could enable the price to rebound.
Traders will consider the scenario of a deeper drop in EUR/USD in case the price settles below 1.0150 on the 4-hour chart. In this case, the instrument may generate a technical signal of a change in trading sentiment.

Trading plan for GBP/USD on November 22
Under such market conditions, the currency pair should be traded in the direction where the price exits from the borders of a trading range. This strategy is applied temporarily and might accumulate trading forces. In turn, this will create an impulse and the price will escape from the range. All in all, it is reasonable to use a breakthrough strategy now. In this case, the price should confirm that the flat market is over by staying beyond the borders at least on the 4-hour chart.
Let's sum up the two scenarios.
The upward scenario and a breakthrough strategy should be applied by traders in case the price settles above 1.2050 on the 4-hour chart. This price action means at least that the flat market is over but could also signal a full-fledged change in trend.
The downward scenario will come in play in case the correctional move is prolonged from the psychological level. So, the ongoing flat market will benefit the sellers. To see this scenario in practice, the price should settle firmly below 1.1750 which will increase the sellers' chance for a further decline in GBP/USD.

What's on technical charts
The candlestick chart shows graphical white and black rectangles with upward and downward lines. While conducting a detailed analysis of each individual candlestick, it is possible to notice its features intrinsic to a particular time frame: the opening price, the closing price, the highest and lowest price.
Horizontal levels are price levels, in relation to which a stop or reversal of the price may occur. They are called support and resistance levels.
Circles and rectangles are highlighted examples where the price reversed in the course of its history. This color highlighting indicates horizontal lines which can exert pressure on prices in the future;
Upward/downward arrows signal a possible future price direction.
 English
 Русский
 Bahasa Indonesia
 Bahasa Malay
 ไทย
ไทย Español
 Deutsch
 Български
 Français
 Tiếng Việt
 中文
中文 বাংলা
বাংলা हिन्दी
 Čeština
 Українська
 Română

