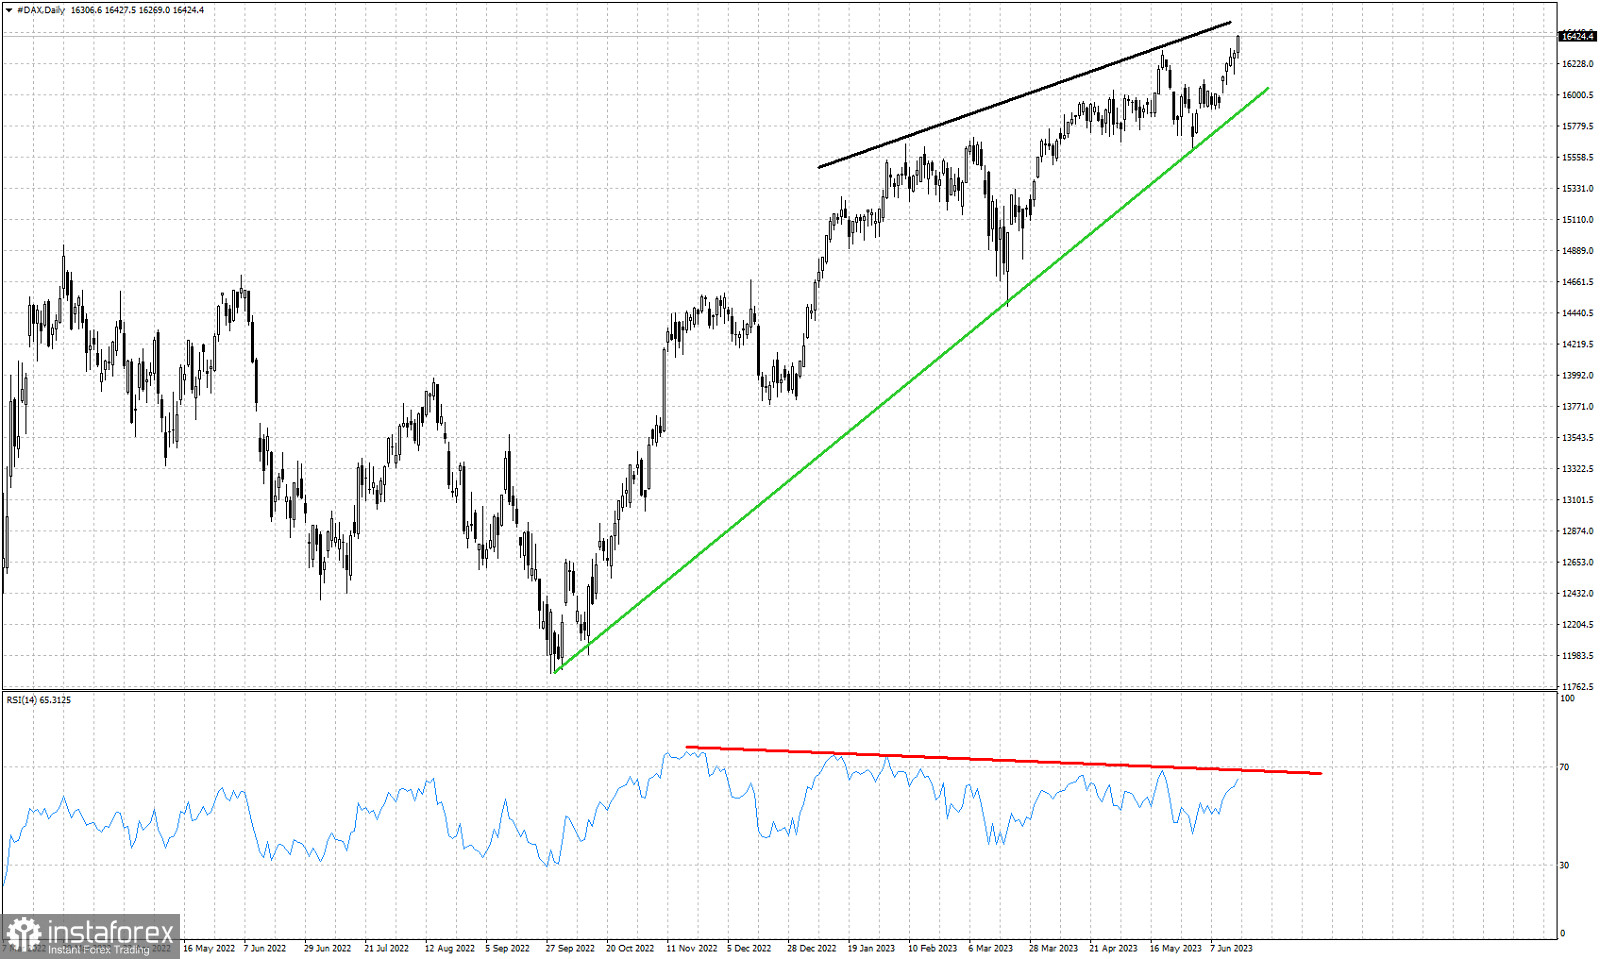
Black line -resistance
Red line- bearish RSI divergence
Green line- support trend line
DAX is trading at new all time highs. In previous posts we noted the technically trend remained bullish and bulls were safe as long as price remained above the green upward sloping support trend line. In the Daily chart the RSI continues to provide bearish divergence signals. This is only a warning. Upside potential we believe is limited to a move up to 16,500 for the near term. There are increased chances of a pull back at current levels. However there is still no reversal sign given by the market.

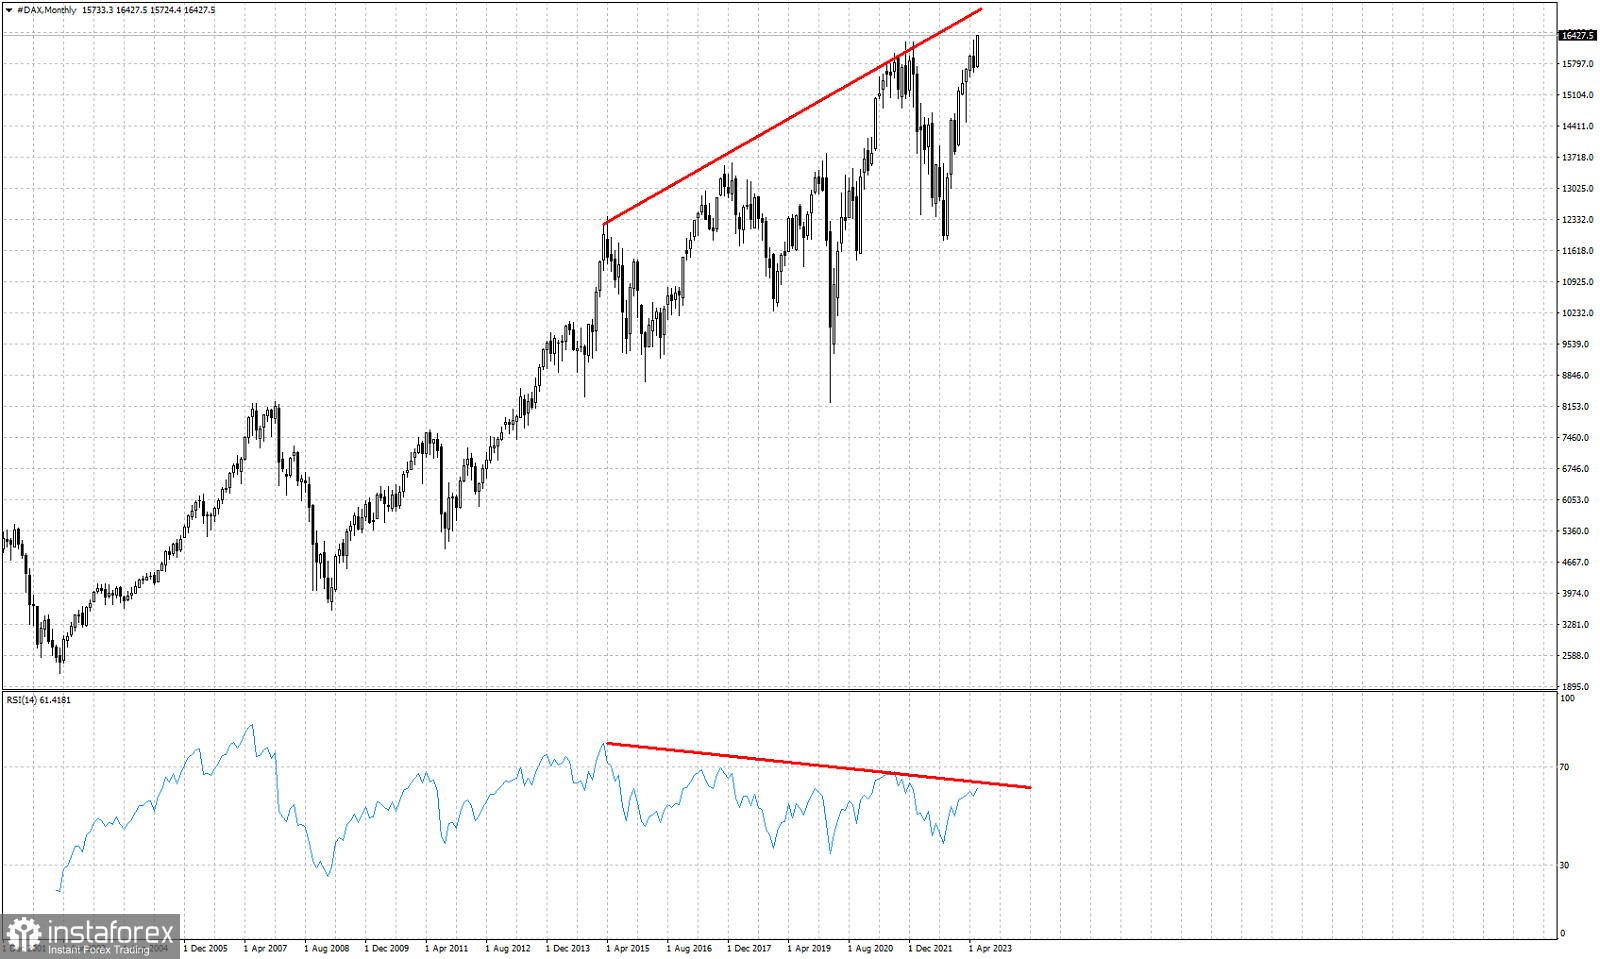
Red lines- monthly bearish RSI divergence
Zooming out and watching the monthly chart in DAX, we observe a lower high in the RSI, to provide the third bearish divergence on a monthly basis. Of course as can be seen above, the bearish divergence should not be used as a reversal signal. Price continues making higher highs. The bearish divergence is here to increase our awareness regarding a weakening up trend. The RSI is here as a complimentary tool. We need to see price break key support levels in order to call for a major reversal. On a monthly basis DAX has the potential to move towards 16,900, However a potential pull back could push the index at least towards 14,700.
 English
 Русский
 Bahasa Indonesia
 Bahasa Malay
 ไทย
ไทย Español
 Deutsch
 Български
 Français
 Tiếng Việt
 中文
中文 বাংলা
বাংলা हिन्दी
 Čeština
 Українська
 Română

