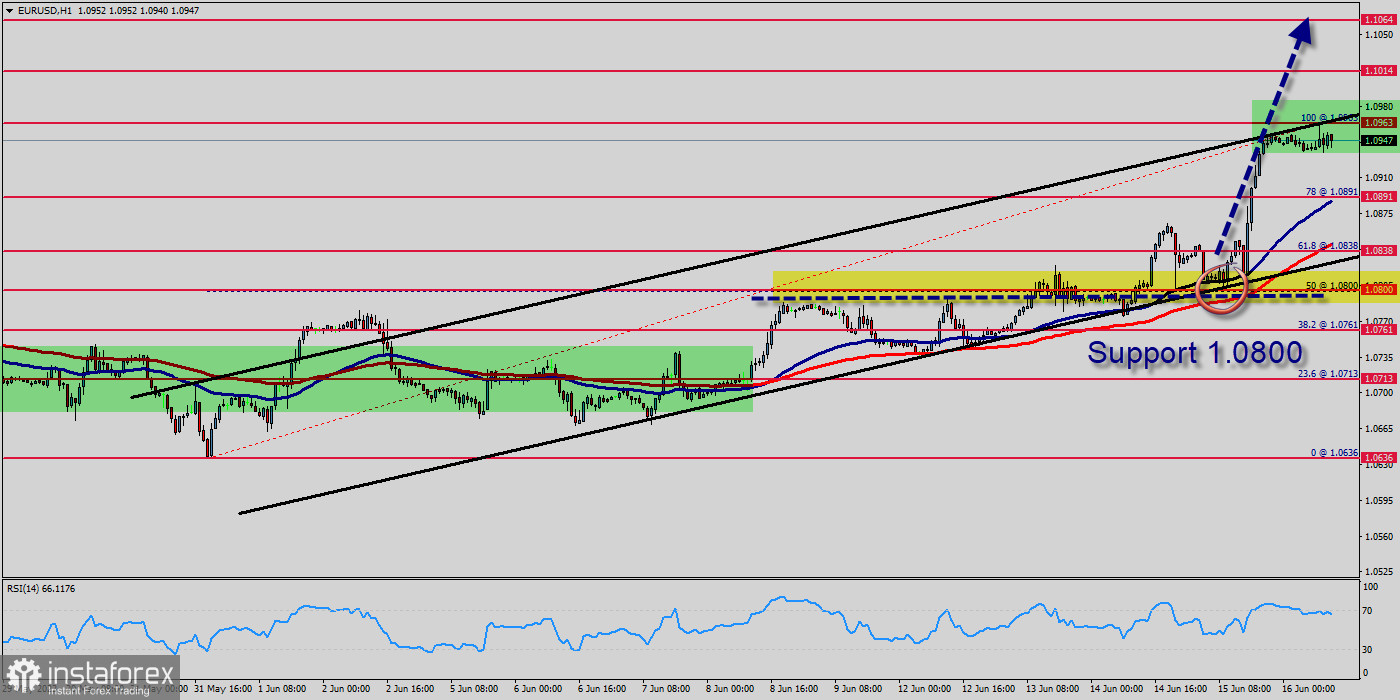
It is a relatively active day for the EUR/USD pair. However, ECB President Lagarde and FMOC members Bullard and Waller will be in focus today.
The numbers are unlikely to influence, barring upward revisions to prelim figures. According to prelim numbers, the annual inflation rate for the Eurozone softened from 7.0% to 6.1% in May. Elevated inflation leaves pressure on the ECB to persist with further policy moves to bring inflation to target.
The European currency (EUR) seems to struggle to continue its weekly sharp rally and motivates the EUR/USD pair to retreat from earlier multi-week peaks near 1.0963 at the end of the week, and area last visited in mid-June - 2023.
In the meantime, risk appetite trends appears somewhat divided as investors continue to adjust to Thursday's hawkish message from the ECB, after the central bank walked the talk and raised rates by 2.5% and signalled that more is coming at the July meeting.
Further close above the high end may cause a rally towards 1.0963. Nonetheless, the weekly resistance level and zone should be considered.
The EUR/USD pair hit the weekly pivot point and resistance 1, because of the series of relatively equal highs and equal lows. But, the pair has dropped down in order to bottom at the point of 1.0891.
Hence, the major support was already set at the level of 1.0891. Moreover, the double bottom is also coinciding with the major support this week. The trend is still calling for a strong bullish market as well as the current price is also above the moving average 100.
Therefore, it will be advantageous to buy above the support area of 1.0891 with the first target at 1.0963. From this point, if the pair closes above the weekly pivot point of 1.0891, the EUR/USD pair may resume it movement to 1.1014 to test the weekly resistance 2.
Stop loss should always be taken into account, accordingly, it will be of beneficial to set the stop loss below the last bottom at 1.0838.
Downside outlook :
The Relative Strength Index (RSI) indicator on the four-hour chart stays above 65 and the EUR/USD pair trades on the outside of the ascending regression channel, reflecting overbought conditions.
In case the EUR/USD pair stages a technical correction, 1.0891 (Fibonacci 78% retracement of the latest downtrend, former resistance, upper-limit of the ascending channel) aligns as important support. With a four-hour close below that level, additional losses toward 1.0838 (Fibonacci 50% retracement, mid-point of the ascending channel) and 1.0838 (100-period Simple Moving Average) could be witnessed.
If EUR/USD manages to stabilize above 1.0940 (static level), it could target 1.1000 (psychological level) and 1.0838 (beginning point of the latest downtrend).
 English
 Русский
 Bahasa Indonesia
 Bahasa Malay
 ไทย
ไทย Español
 Deutsch
 Български
 Français
 Tiếng Việt
 中文
中文 বাংলা
বাংলা हिन्दी
 Čeština
 Українська
 Română

