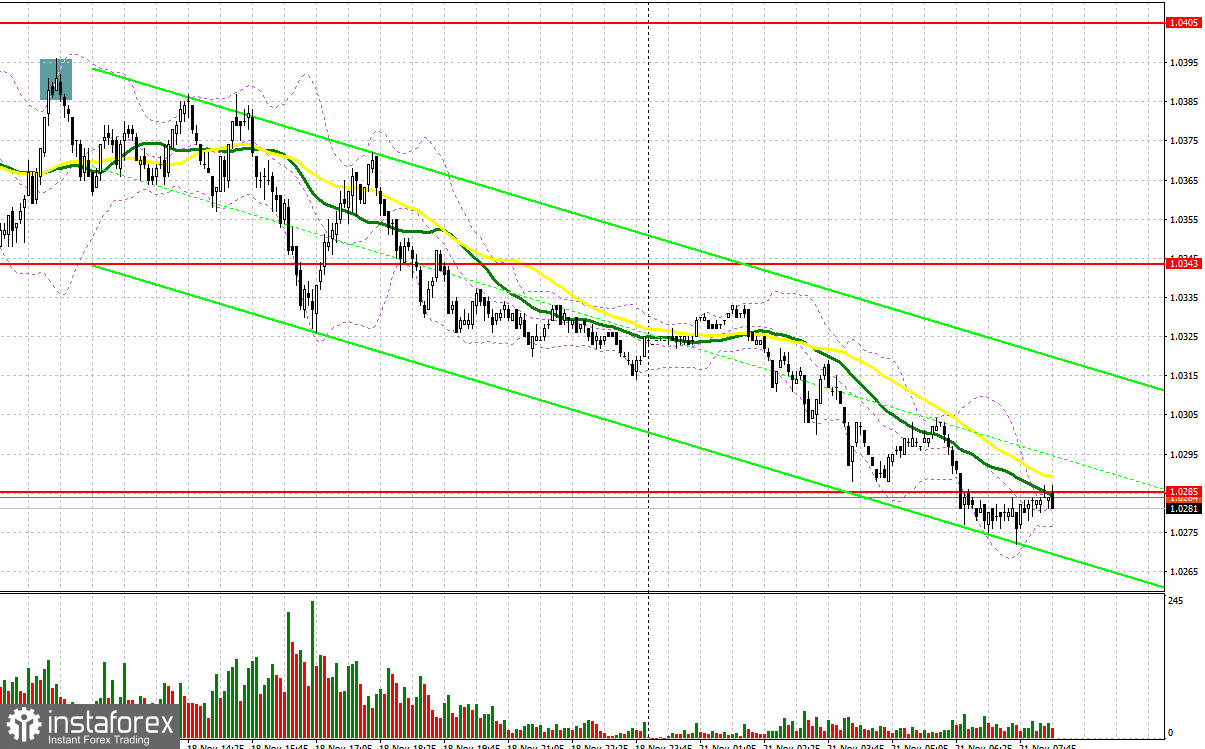
Last Friday there was only one entry signal. Let us look at the 5-minute chart and figure out what happened. In my morning outlook I noted the level of 1.0384 and recommended making market entry decisions with this level in mind. The pair hit this level rather quickly in the first half of the day, but the buyers did not manage to move higher on their second attempt to test it. As a result, a sell signal was created, and the pair moved down by more than 40 pips. During the American session there were no suitable entry signals.

When to open long positions on EUR/USD:
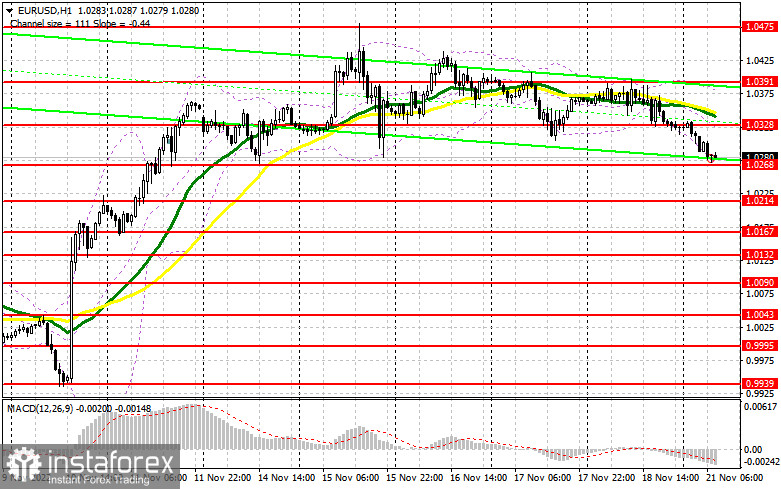
US real estate data again put pressure on the European currency and provided support to the US dollar. This in turn pushed the pair down. Today, during the Asian session, risky assets fell on the news that China is once again imposing COVID-19 quarantine measures, which brought the European currency down as well. Currently, euro bulls may lose the lower boundary of the new sideways channel at 1.0268, which will start a new bearish trend. With only German PPI data for October being released today, do not be surprised if bulls will continue to sit on the sidelines and watch for their trend to end. If there is a negative reaction to the inflation report, the best opportunity for opening long positions in the current situation would be a false breakdown of the nearest support level of 1.0268. It will help confirm the presence of major bullish market players and return EUR/USD to 1.0328, which is located in the middle of a sideways channel. Above this level lie the moving averages, which are already favorable for bears. In case of a breakout and a downward test of this range, I would expect a renewed rally to 1.0391. Above this range is 1.0475, which is a monthly high. A breakout above this level will also trigger Stop Loss orders of bears and create an additional buy signal. The pair may also surge to 1.0525, which will extend the bullish trend. If the EUR/USD declines and buyers are inactive at 1.0268, the pressure on the euro will increase, and the situation will drastically deteriorate for bullish traders. This will push EUR/USD down to the next support level at 1.0214. Long positions should be opened there only during a false breakout. You can buy EUR/USD immediately if it bounces from 1.0167 or even 1.0132, keeping in mind an upward intraday correction of 30-35 pips.
Where to open short positions on EUR/USD:
It is obvious that bears are doing their best to push the euro as low as possible at the beginning of this week. Bearish traders need to break below the support at 1.0268, which will start a new downtrend, in order to gain full control of the market. You should also keep an eye on 1.0328. The formation of a false breakout there will create an excellent entry point, and open the way towards the supports at 1.0268. A consolidation below this range will occur if German inflation data is weak, which will indicate that inflation is slowing down. This will allow the European Central Bank to take a breather. A reverse upward test of 1.0268 will be the reason for selling EUR/USD with the aim of triggering the bulls' Stop Loss orders and sending the pair into the 1.0214 area. Euro buyers will be active again in this area and will start to take advantage of the decline. The most distant target is 1.0167, where I recommend taking profits. If EUR/USD moves up during the European session and bears are idle at 1.0328, the demand for the pair will increase, which may extend the bull market. The pair may hit 1.0391 afterwards. In this case, I advise you not to rush with going short on EUR/USD and open short positions there only if a false breakout is formed. You can sell the pair immediately if it rebounds from the high of 1.0475 or from 1.0525, keeping in mind a downward intraday correction of 30-35 pips.

COT report:
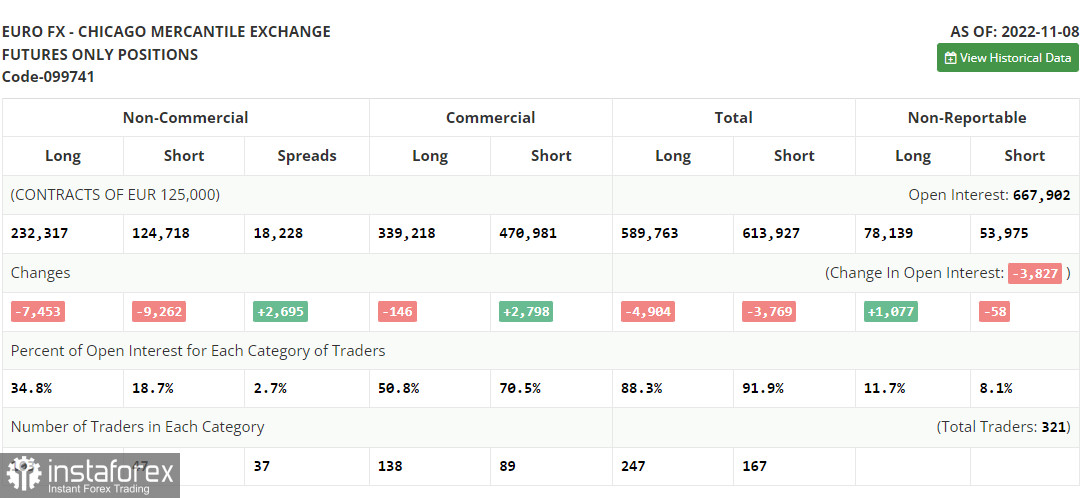
According to the Commitment of Traders (COT) report for November 8, both short and long positions increased. These data do not take into account the market situation after the release of US inflation data, so you should not trust the current COT data much. Price growth merely slowed down – it did not decrease. Even though US inflation slowed down to a larger degree than previously anticipated, the Federal Reserve will continue to follow its policy and raise interest rates. The Fed funds rate is expected to be increased by 0.5%-0.75% in December. As for the euro, the demand for risky assets has indeed grown slightly. However, besides the Fed potentially slowing down monetary tightening, a further increase in interest rates in the eurozone should be considered. More European politicians have stated recently that interest rates should be hiked further to deal with rising inflation. However, if the EU economy continues to contract at a rapid pace, aggressive rate hikes can be halted, which will limit the upward potential of the pair in the medium term. The COT report indicated that long non-commercial positions decreased by 7,453 to 232,317, while short non-commercial positions fell by 9,262 to 124,718. At the end of the week, the total non-commercial net position remained positive and stood at 107,599 against 105,790 a week ago. This indicates that investors continue to take advantage of the situation and buy cheap euro even above parity. They also accumulate long positions, expecting the crisis to end and the pair to recover in the long term. The weekly closing price increased to 1.0104 from 0.9918.

Indicators' signals:
Moving averages
Trading is carried out below 30-day and 50-day moving averages, which indicates that the pair is now under renewed pressure.
Note: The period and prices of moving averages are considered by the author on the H1 (1-hour) chart and differ from the general definition of the classic daily moving averages on the daily D1 chart.
Bollinger Bands
If EUR/USD moves up, the indicator's upper border at 1.0391 will serve as support. If the pair slides down, the lower border at 1.0268 will serve as support.
Description of indicators
• Moving average (moving average, determines the current trend by smoothing out volatility and noise). Period 50. It is marked yellow on the chart.
• Moving average (moving average, determines the current trend by smoothing out volatility and noise). Period 30. It is marked green on the chart.
• MACD indicator (Moving Average Convergence/Divergence - convergence/divergence of moving averages) Quick EMA period 12. Slow EMA period to 26. SMA period 9
• Bollinger Bands (Bollinger Bands). Period 20
• Non-commercial speculative traders, such as individual traders, hedge funds, and large institutions that use the futures market for speculative purposes and meet certain requirements.
• Long non-commercial positions represent the total long open position of non-commercial traders.
• Short non-commercial positions represent the total short open position of non-commercial traders.
• Total non-commercial net position is the difference between the short and long positions of non-commercial traders.
 English
 Русский
 Bahasa Indonesia
 Bahasa Malay
 ไทย
ไทย Español
 Deutsch
 Български
 Français
 Tiếng Việt
 中文
中文 বাংলা
বাংলা हिन्दी
 Čeština
 Українська
 Română

