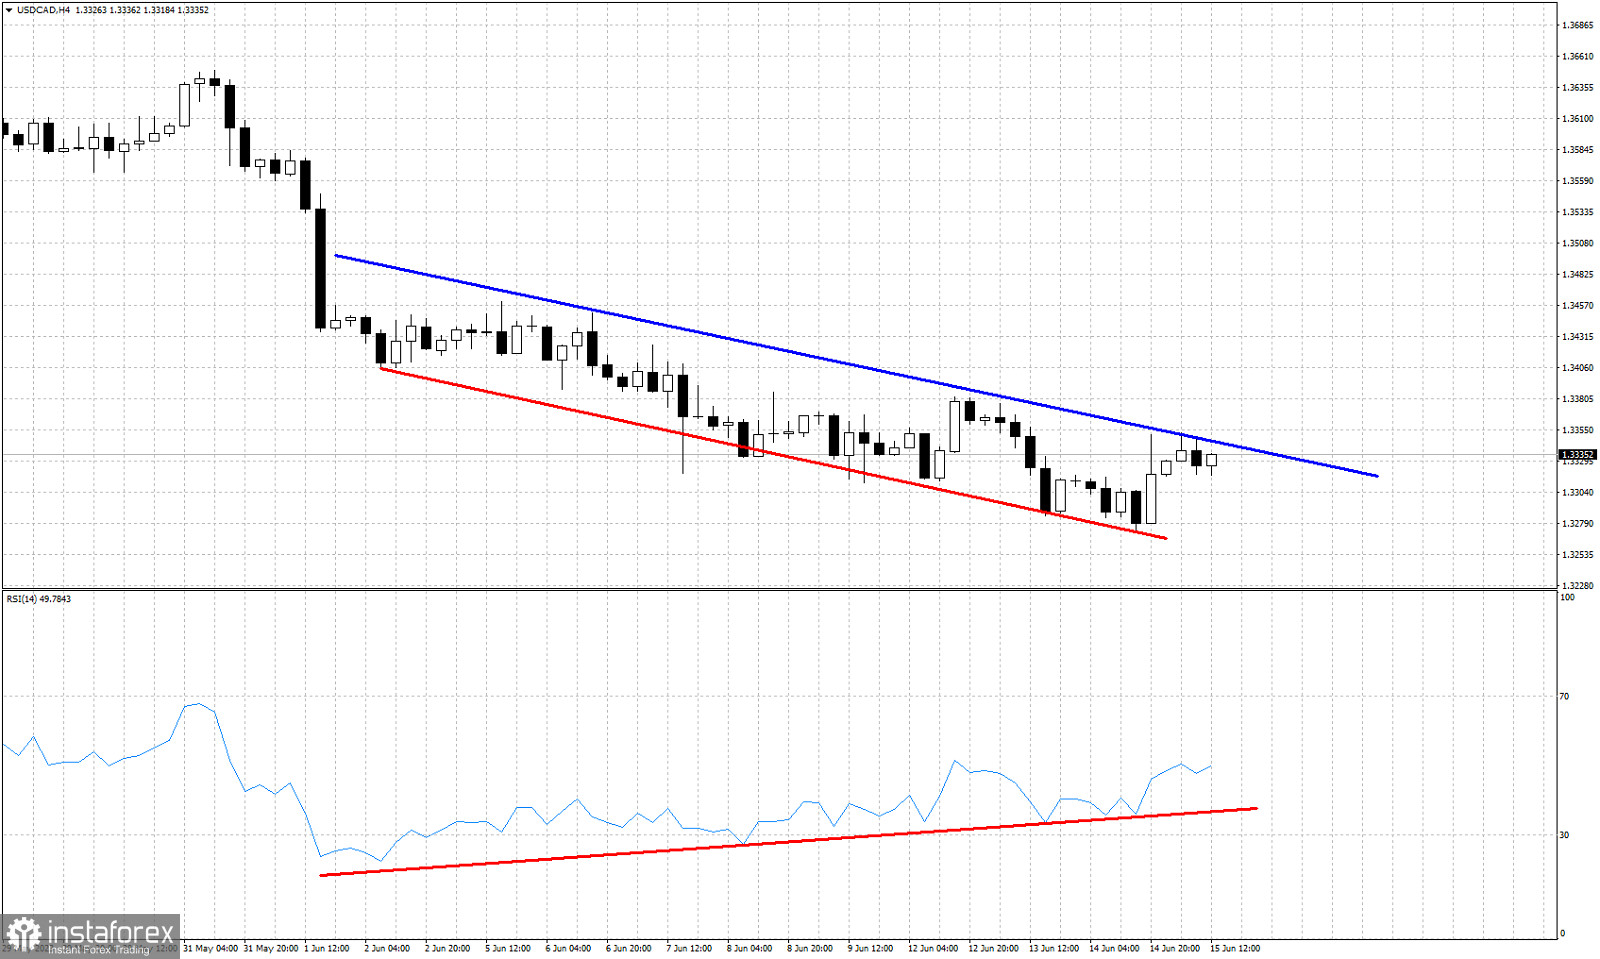
Blue line- resistance
Red lines- bullish RSI divergence
USDCAD remains in a bearish trend. USDCAD continues making lower lows and lower highs as price is now trading around 1.3330. Price is challenging the short-term resistance trend line. The RSI continues forming higher lows despite the lower lows in price. The bullish RSI divergence suggests that we are very close to seeing a reversal in short-term trend. A break above 1.3360 would be the first sign of such a possible reversal. Bulls need to overcome today's highs and start making higher highs and higher lows. For the time being there is no confirmed reversal signs. The RSI suggests that the downtrend is weakening and soon we will see a reversal.
 English
 Русский
 Bahasa Indonesia
 Bahasa Malay
 ไทย
ไทย Español
 Deutsch
 Български
 Français
 Tiếng Việt
 中文
中文 বাংলা
বাংলা हिन्दी
 Čeština
 Українська
 Română

