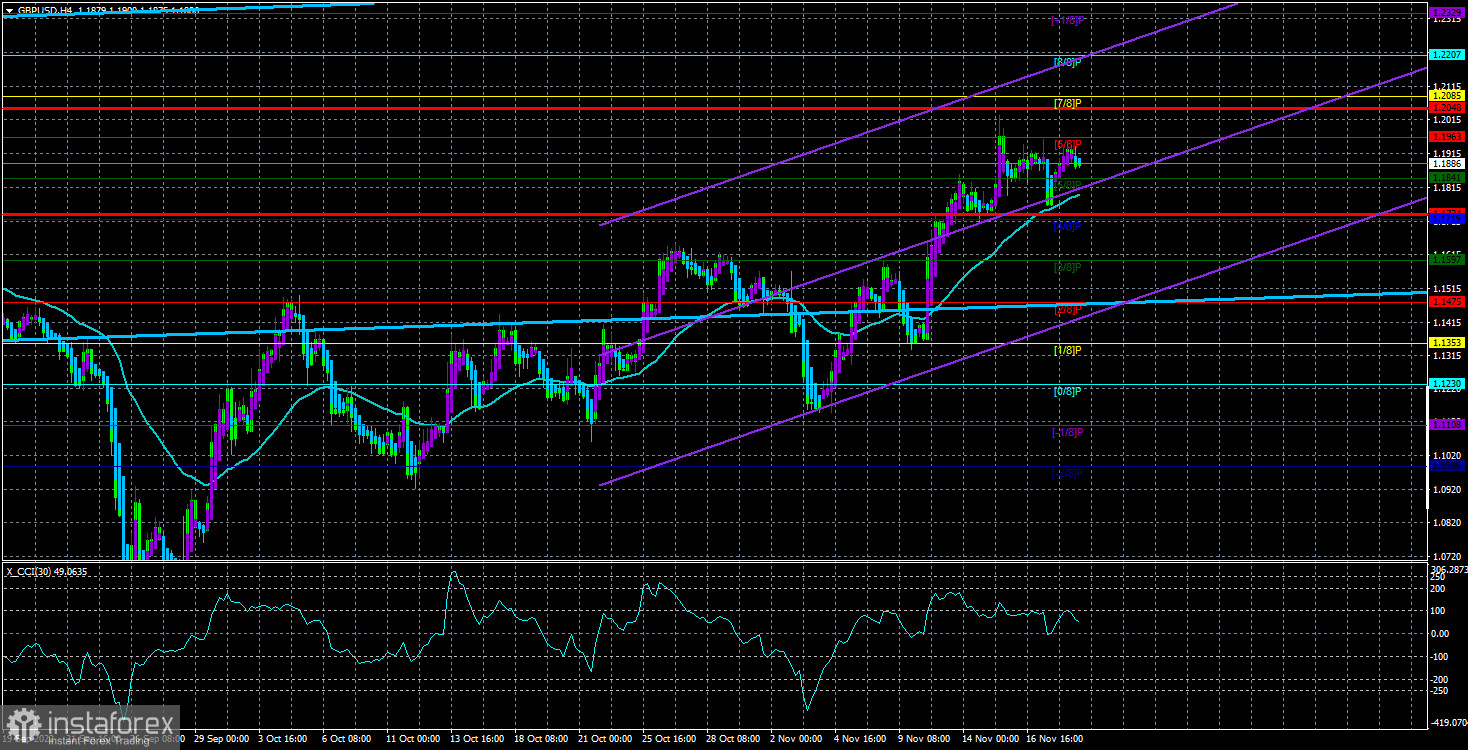
On Friday, the GBP/USD currency pair also carried on with apparent reluctance. In theory, both currency pairs traded in line with their best practices and had a dull trading week. The technical images for the euro and the pound are thus identical. Most technical indicators point to an upward trend on almost all TF, both currencies are above the moving averages, and one of the linear regression channels is pointing upwards. As anticipated, there was no significant correction; instead, both pairs remained stationary for a full week. Since they moved in tandem this week, the euro and the pound have formal reasons to keep rising. But we still don't know why both currencies have appreciated so much over the past few weeks or what will allow them to do so. New or invented reasons can always be "found." However, we make an effort to refrain from doing this.
As usual, there are more issues with the British pound than with the euro or the dollar. If the US economy's recession is only "possible to start," the European Union's recession "will begin, but it may be weak," and the UK's recession "has already started and will be at least long," respectively. If inflation is high throughout the European Union and the US but is already declining, it is extremely high in the UK and is still rising despite eight rate increases by the Bank of England. Additionally, a 50 billion pound "hole" in the British budget will be "patched up" in the simplest way possible by reducing spending and raising taxes. In reality, tax rates won't go up; however, in place of the high-income tax rate that previously applied to Britons with incomes over 150,000 pounds annually, the low-income tax rate will now apply to those with incomes under 125,000 pounds. Consequently, a specific group of people will see an increase in tax rates. On the other hand, the state will reduce its support for paying electricity bills, which have increased significantly.
The most intriguing news of the week is the business activity index.
This week, the same "gentleman's" set of macroeconomic principles will apply in the UK and the EU. Members of the central bank's monetary committee made the same speeches, and business activity indices were used. All three business activity indices share the same fundamental characteristics:
- They are all below the "waterline" of 50.0.
- They are all unlikely to experience significant growth (there is simply no basis for this).
- They are all likely to keep declining.
Regarding Cunliffe and Pill's speeches, both adhere to the rhetoric regarding the ongoing fight against inflation and speak frequently.
The most intriguing aspect is that the same business activity indices and speeches by Fed members will be published in the US. Only the manufacturing sector's business activity index, among the others, may stay above 50.0, but predictions indicate that it will also dip below this level. We won't see or hear anything new because James Bullard, Loretta Meister, and other Fed members are likely to discuss the need to slow down the pace of monetary policy tightening. The States will also release "standard" reports on orders for long-term goods and applications for unemployment benefits, to which the market rarely responds. This week, we would say, has the best chance of flat-like movement. Given the fundamental and macroeconomic context, it is challenging to anticipate new growth in the euro and the pound. Once more, a downward correction would be a far more sensible course of action.

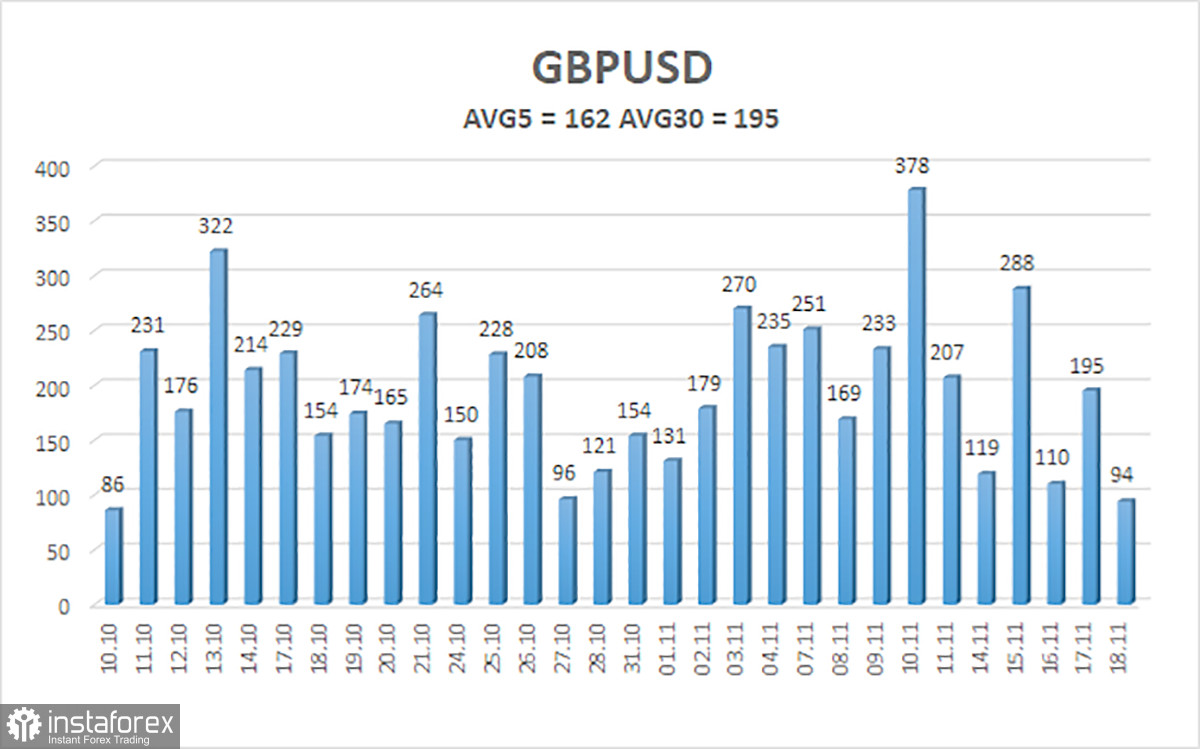
Over the previous five trading days, the GBP/USD pair has experienced an average volatility of 162 points. This value for the dollar/pound exchange rate is "very high." Thus, we anticipate movement inside the channel on Monday, November 21, constrained by 1.1734 and 1.2048. The Heiken Ashi indicator's upward reversal suggests that the upward trend may continue.
Nearest levels of support
S1 – 1.1841
S2 – 1.1719
S3 – 1.1597
Nearest levels of resistance:
R1 – 1.1963
R2 – 1.2085
R3 – 1.2207
Trading Suggestions:
In the 4-hour timeframe, the GBP/USD pair has begun a new round of downward correction. Therefore, in the event of an upward reversal of the Heiken Ashi indicator, buy orders with targets of 1.2048 and 1.2085 should still be considered. With targets of 1.1719 and 1.1597, open sell orders should be fixed below the moving average.
Explanations of the illustrations:
Linear regression channels – help determine the current trend. The trend is strong if both are directed in the same direction.
The moving average line (settings 20.0, smoothed) – determines the short-term trend and the direction in which trading should be conducted now.
Murray levels – target levels for movements and corrections.
Volatility levels (red lines) – the likely price channel in which the pair will spend the next day, based on current volatility indicators.
The CCI indicator – its entry into the oversold area (below -250) or into the overbought area (above +250) means that a trend reversal in the opposite direction is approaching.
 English
 Русский
 Bahasa Indonesia
 Bahasa Malay
 ไทย
ไทย Español
 Deutsch
 Български
 Français
 Tiếng Việt
 中文
中文 বাংলা
বাংলা हिन्दी
 Čeština
 Українська
 Română

