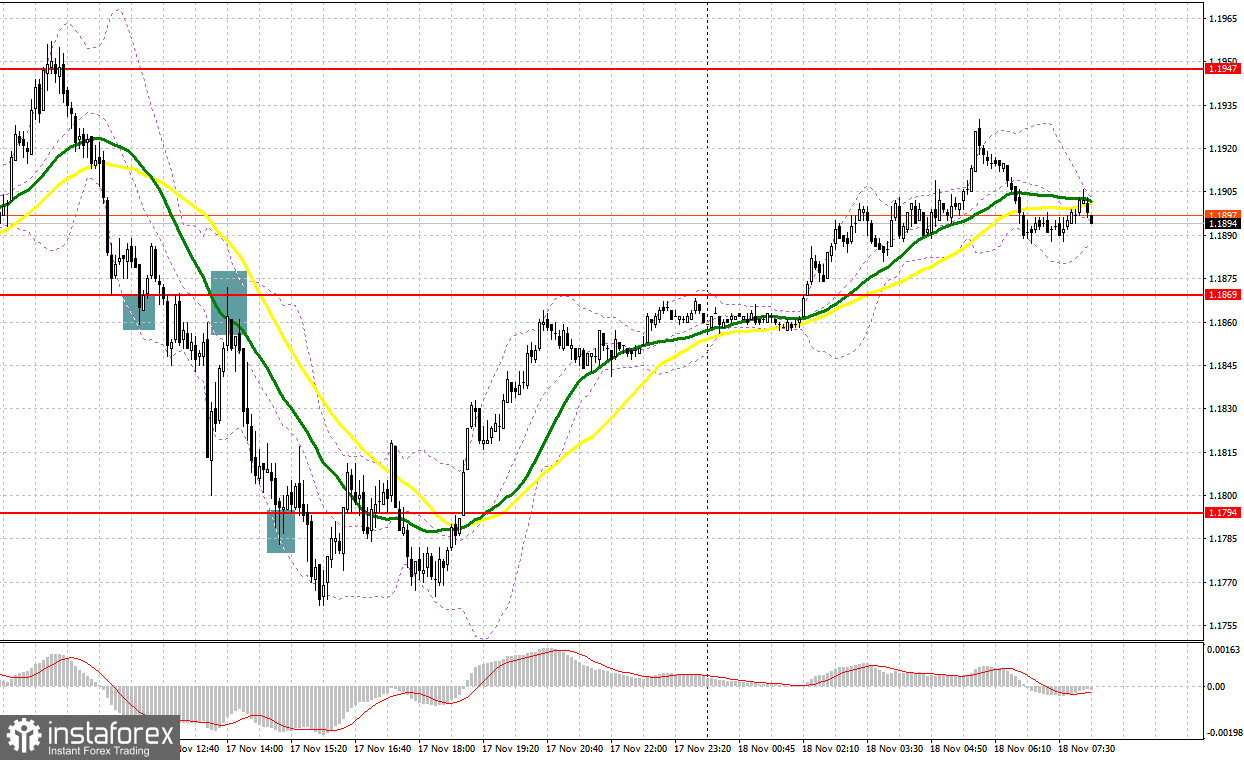
Yesterday there were several signals to enter the market. Let us take a look at the 5-minute chart to figure out what happened. Earlier, I asked you to pay attention to 1.1917 to decide when to enter the market. The bulls broke through above 1.1917 without any problems in the first half of the day, but the reverse test downwards of this level, which I marked with blue lines on the chart, did not come to a normal, in my opinion, reverse test. For this reason, I missed the upward move in the morning, although I did not particularly regret it, since it did not last long. In the afternoon, after the pound fell to the support area of 1.1869, it was possible to get a buy signal on a false breakout, but to my regret, there was no major upward movement, which led to fixing losses. A breakout and reverse test of 1.1869 gave a sell signal, resulting in a drop of over 50 pips. Long positions on 1.1794 did not bring the expected result.

When to go long on GBP/USD:
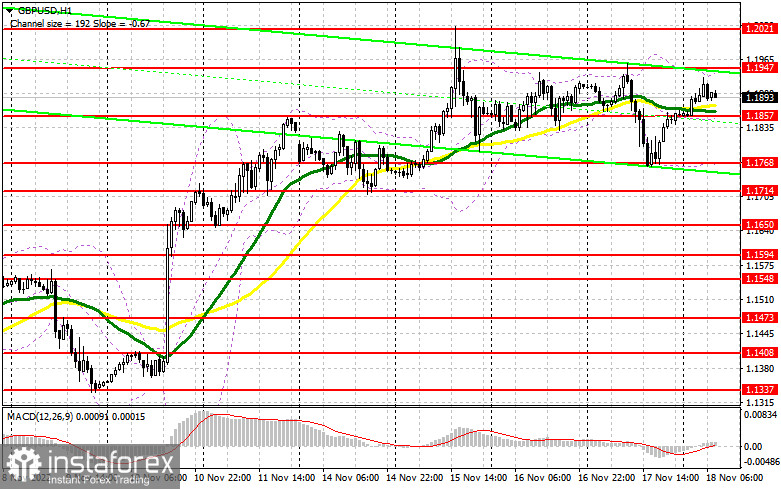
The pound corrected enough after the release of the UK budget, however, the bulls quickly bought out the downward movement, keeping the market under their control. This once again proves their presence and allows us to count on the pair's growth in the short term. The UK Treasury Secretary did not say anything unexpected yesterday, which helped to maintain demand for the British pound. The data on the index of retail sales and the volume of retail sales in the UK in October of this year will be released this morning. Growth is expected, which should help the pound surpass 1.1947. Of course, the best option for opening longs in the current conditions would be when it falls in the area of the nearest support of 1.1857, formed on the basis of yesterday. A false breakout there will give a buy signal in order to restore and update the resistance of 1.1947, above which it was not possible to break through yesterday.
A breakout and test down this range amid hawkish statements from Monetary Policy Committee member Haskell will help strengthen the bulls' position and bring back their advantage. An exit above 1.1947 will provide an opportunity to build a more powerful trend with the prospect of a return to 1.2021. The farthest target will be 1.2078, where I recommend taking profits.
If the bulls do not cope with their tasks and miss 1.1857, which could happen in the morning, the pressure on the pair will sharply increase as the bears will feel confident in their abilities. If this happens, I advise you to buy only on a false breakout at 1.1768. It is also possible to buy the asset just after a bounce off from 1.1714, or even lower - around 1.1650, expecting a rise of 30-35 pips.
When to go short on GBP/USD:
Bears were active yesterday and failed the pound quite badly. They weren't strong enough to hold on to the achieved lows. Today we have to start all over again. Much currently depends on retail sales data. A sharp decline, contrary to economists' forecasts, will lead to the pound being sold in the short term. However, it is much more important to maintain control over the resistance at 1.1947, which was formed following yesterday's results. The pound cannot be released above this level, otherwise the bullish trend will continue with renewed vigor. A false breakout at 1.1947 will help push the GBP/USD to 1.1857, where the moving averages are, playing on the bulls' side.
A breakout and reverse test upwards of this range will provide an entry point in anticipation of a return to 1.1768, which will make life difficult for bulls who are counting on strengthening the bullish trend. The farthest target will be the area of 1.1714, where I recommend locking in profits. A test of this area will cross out all bullish prospects for the pound. In case the pair grows and bears fail to protect 1.1947, bulls will continue to enter the market. This will push the GBP/USD to the 1.2021 area. A false breakout at this level will provide an entry point into shorts with the goal of moving down. If bears are not active there, I advise you to go short from the monthly high of 1.2078, expecting a decline of 30-35 pips.

COT report:
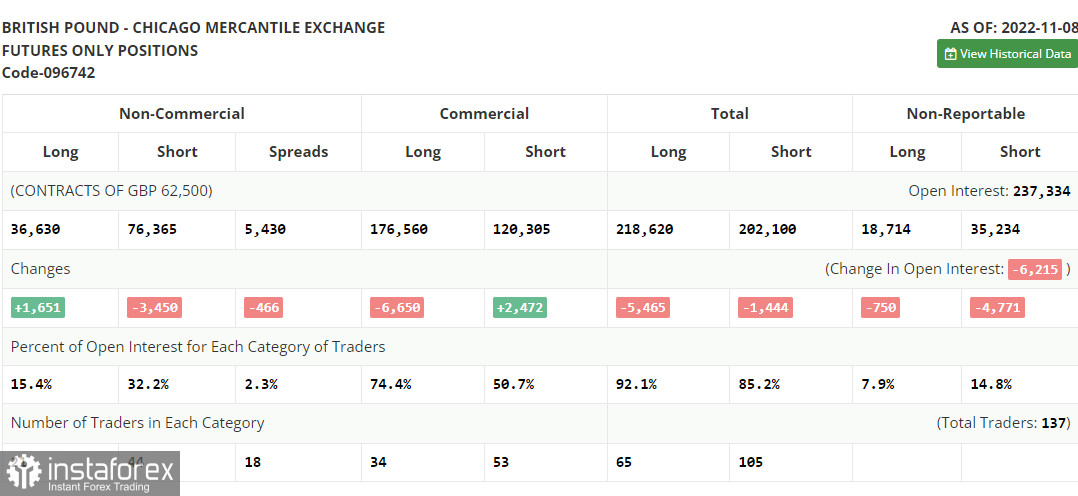
The Commitment of Traders (COT) for November 8 logged a decrease in short positions and an increase in long ones. The results of the Bank of England meeting influenced the balance of trading forces. Although the regulator no longer plans to pursue a super-aggressive policy, demand for the pound is still buoyant. The currency encountered support following the release of the lower-than-expected US inflation report. It remains to be seen how long this will help bulls to hold GBP at highs. The recent GDP data confirmed the fact that the UK economy is in dire stairs, which put pressure on the government. Meanwhile, the Bank of England slows down the economy even more with its rate hikes. In the near term, the labor market data will be released. If the figures come disappointing, the pound may tumble. According to the latest COT report, long non-commercial positions rose by 1,651 to 36,630 and short non-commercial positions decreased by 3,450 to 76,365, which led to a further decline in the negative non-commercial net position to -39,735 from -44,836 a week earlier. The weekly closing price of GBP/USD grew to 1.1549 against 1.1499 in the previous week.

Indicator signals:
Trading is performed above the 30 and 50-day moving averages, which indicates a possible continuation of the pound's growth.
Moving averages
Note: The period and prices of moving averages are considered by the author on the one-hour chart, which differs from the general definition of the classic daily moving averages on the daily chart.
Bollinger Bands
In case the pair drops, the lower limit of the indicator around 1.1768 will act as support.
Description of indicators
- Moving average (moving average, determines the current trend by smoothing volatility and noise). The period is 50. It is marked in yellow on the chart.
- Moving average (moving average, determines the current trend by smoothing volatility and noise). The period is 30. It is marked in green on the graph.
- MACD indicator (Moving Average Convergence/Divergence - convergence/divergence of moving averages). A fast EMA period is 12. A slow EMA period is 26. The SMA period is 9.
- Bollinger Bands. The period is 20.
- Non-profit speculative traders are individual traders, hedge funds, and large institutions that use the futures market for speculative purposes and meet certain requirements.
- Long non-commercial positions are the total number of long positions opened by non-commercial traders.
- Short non-commercial positions are the total number of short positions opened by non-commercial traders.
- The total non-commercial net position is a difference in the number of short and long positions opened by non-commercial traders.
 English
 Русский
 Bahasa Indonesia
 Bahasa Malay
 ไทย
ไทย Español
 Deutsch
 Български
 Français
 Tiếng Việt
 中文
中文 বাংলা
বাংলা हिन्दी
 Čeština
 Українська
 Română

