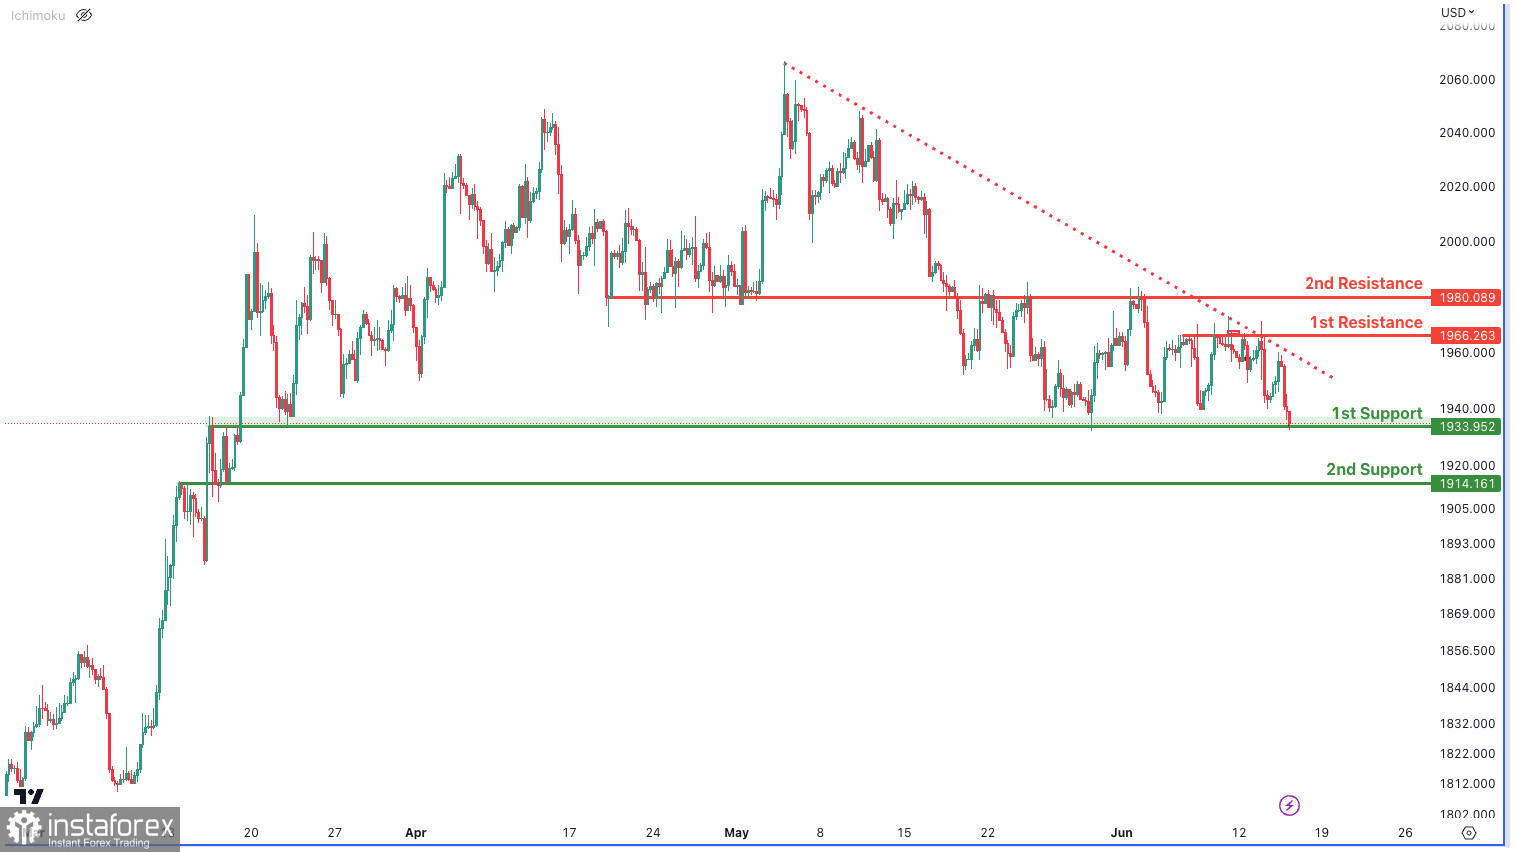
The XAU/USD chart indicates a bearish trend as the price is below a significant descending trend line. In the short term, there is potential for a price rise towards the first resistance level at 1966.26, which previously acted as a swing high resistance. If bullish momentum continues, the second resistance level at 1980.08, an overlap resistance, could pose a stronger barrier. Conversely, the first support level at 1933.95, an overlap support
 English
 Русский
 Bahasa Indonesia
 Bahasa Malay
 ไทย
ไทย Español
 Deutsch
 Български
 Français
 Tiếng Việt
 中文
中文 বাংলা
বাংলা हिन्दी
 Čeština
 Українська
 Română

