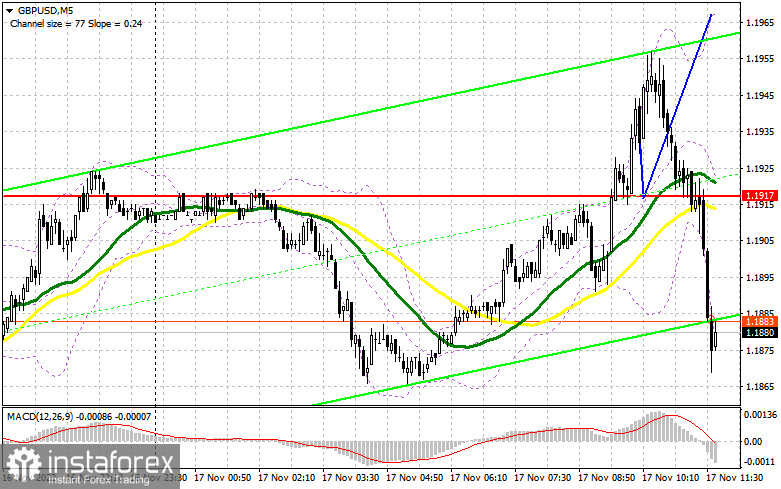
In my morning forecast, I paid attention to the 1.1917 level and recommended entering the market there. Let's look at the 5-minute chart and figure out what happened. Bulls had no problem breaking above 1.1917 in the first half of the day, but the reverse test from top to bottom of this level, which I marked on the chart with blue lines, did not reach the normal level. For this reason, I missed the morning upward movement, although I didn't regret it much since it lasted only a short time. In the afternoon, the technical picture changed.

To open long positions on GBP/USD, you need the following:
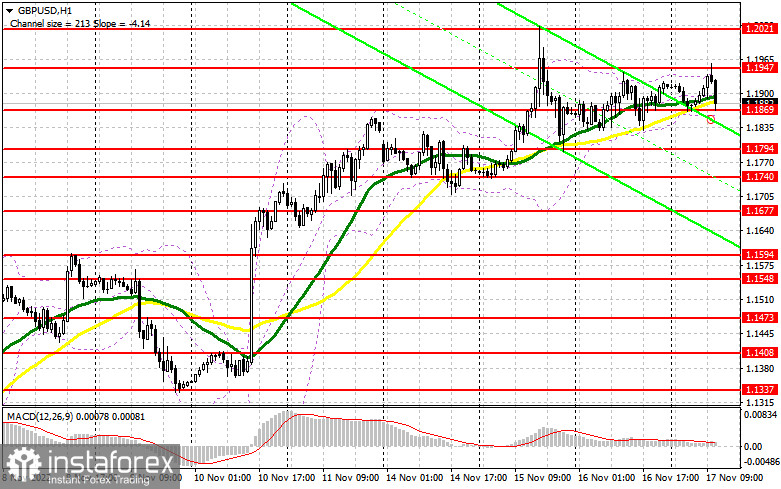
As I said, a lot will depend on what the Chancellor of the Exchequer of Great Britain tells us today and what decisions are made. Not only will this cause a spike in volatility, but we also expect several US statistics in the second half of the day, which could affect the pound's market direction. If the real estate market in the United States slows more than economists predict, dollar pressure will return, and the pound will resume active growth. If the overall situation remains stable, the pair will sink; in this case, it is better not to rush into purchases. In the case of a decline in the pound, the best option for opening long positions will be the formation of a false breakdown in the new support area at 1.1869, which was formed by yesterday's results and which I decided to ignore in the morning. Above this level are the moving averages playing on the bulls' side. Only this will give a signal to buy to return and update the resistance of 1.1947, where sellers have already shown themselves once today. A breakthrough and a top-down test of 1.1947 will allow you to build a more powerful trend with the prospect of a breakthrough to 1.2021. The farthest goal will be the maximum of this month (1.2078), where I recommend fixing the profits. If the bulls fail to meet their objectives in the afternoon and miss 1.1869, a larger profit-taking will begin. This will put pressure back on the pair and open the door to 1.1794. In this case, I recommend buying only on a false breakdown. I recommend opening long positions on GBP/USD immediately for a rebound from 1.1740, or even lower – around 1.1677 to correct 30-35 points inside the day.
To open short positions on GBP/USD, you need the following:
Sellers are fighting back as best they can, and if the pound fails to return to the monthly maximum in the near future, we can count on a larger fall in the short term. The entire calculation will be based on strong fundamental data for the United States. In the meantime, the bears must consider how to defend 1.1947 – the resistance formed in the first half of the day. Only with a false breakdown will there be a signal to open short positions against the trend, pushing the pound back to 1.1869. A breakthrough and a reverse test from the bottom up of 1.1869, as well as strong data on the US real estate market indicating the continued stability of the American economy, as well as hawkish calls from representatives of the Federal Reserve System – all this will give an entry point in the expectation of a return to 1.1794. The farthest target will be the 1.1740 area, where I recommend fixing the profits. With the option of an upward movement of GBP/USD and the absence of bears at 1.1947, the bulls will continue to return to the market with the expectation of a new wave of growth and the continuation of the uptrend. This will push GBP/USD to the area of 1.2021. Only a false breakout on this level will provide an entry point into short positions to move down. In case of a lack of activity there, I advise you to sell GBP/USD immediately from 1.2078, counting on the pair's rebounding down by 30-35 points within a day.


Signals of indicators:
Moving Averages
Trading is conducted above the 30 and 50-day moving averages, which indicates further growth of the pound.
Note: The author considers the period and prices of moving averages on the hourly chart H1 and differs from the general definition of the classic daily moving averages on the daily chart D1.
Bollinger Bands
In case of a decline, the lower limit of the indicator, around 1.1860, will act as support.
Description of indicators
- Moving average (moving average determines the current trend by smoothing out volatility and noise). Period 50. The graph is marked in yellow.
- Moving average (moving average determines the current trend by smoothing out volatility and noise). Period 30. The graph is marked in green.
- MACD indicator (Moving Average Convergence / Divergence - moving average convergence/divergence) Fast EMA period 12. Slow EMA period 26. SMA period 9
- Bollinger Bands (Bollinger Bands). Period 20
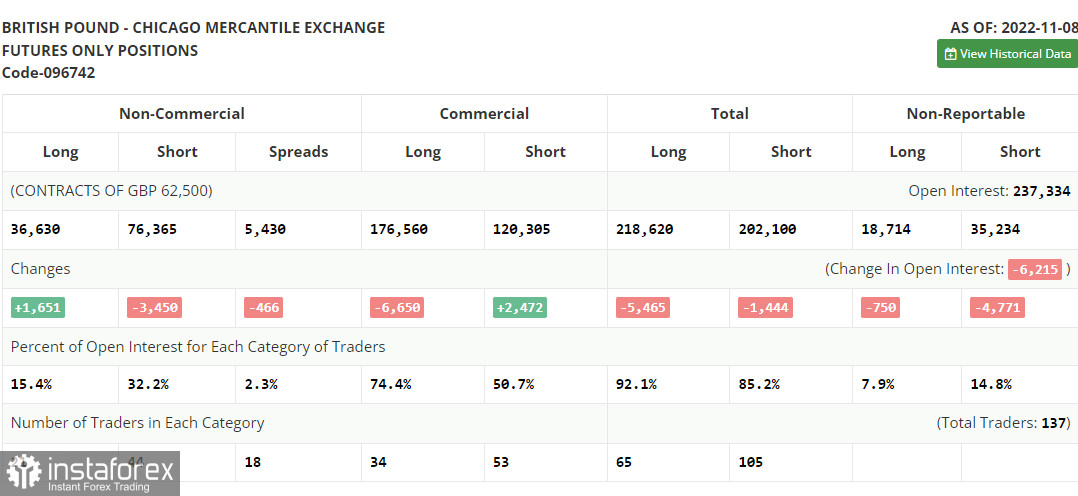
- Non-profit speculative traders, such as individual traders, hedge funds, and large institutions, use the futures market for speculative purposes and to meet certain requirements.
- Long non-commercial positions represent the total long open position of non-commercial traders.
- Short non-commercial positions represent the total short open position of non-commercial traders.
- Total non-commercial net position is the difference between the short and long positions of non-commercial traders.
 English
 Русский
 Bahasa Indonesia
 Bahasa Malay
 ไทย
ไทย Español
 Deutsch
 Български
 Français
 Tiếng Việt
 中文
中文 বাংলা
বাংলা हिन्दी
 Čeština
 Українська
 Română

