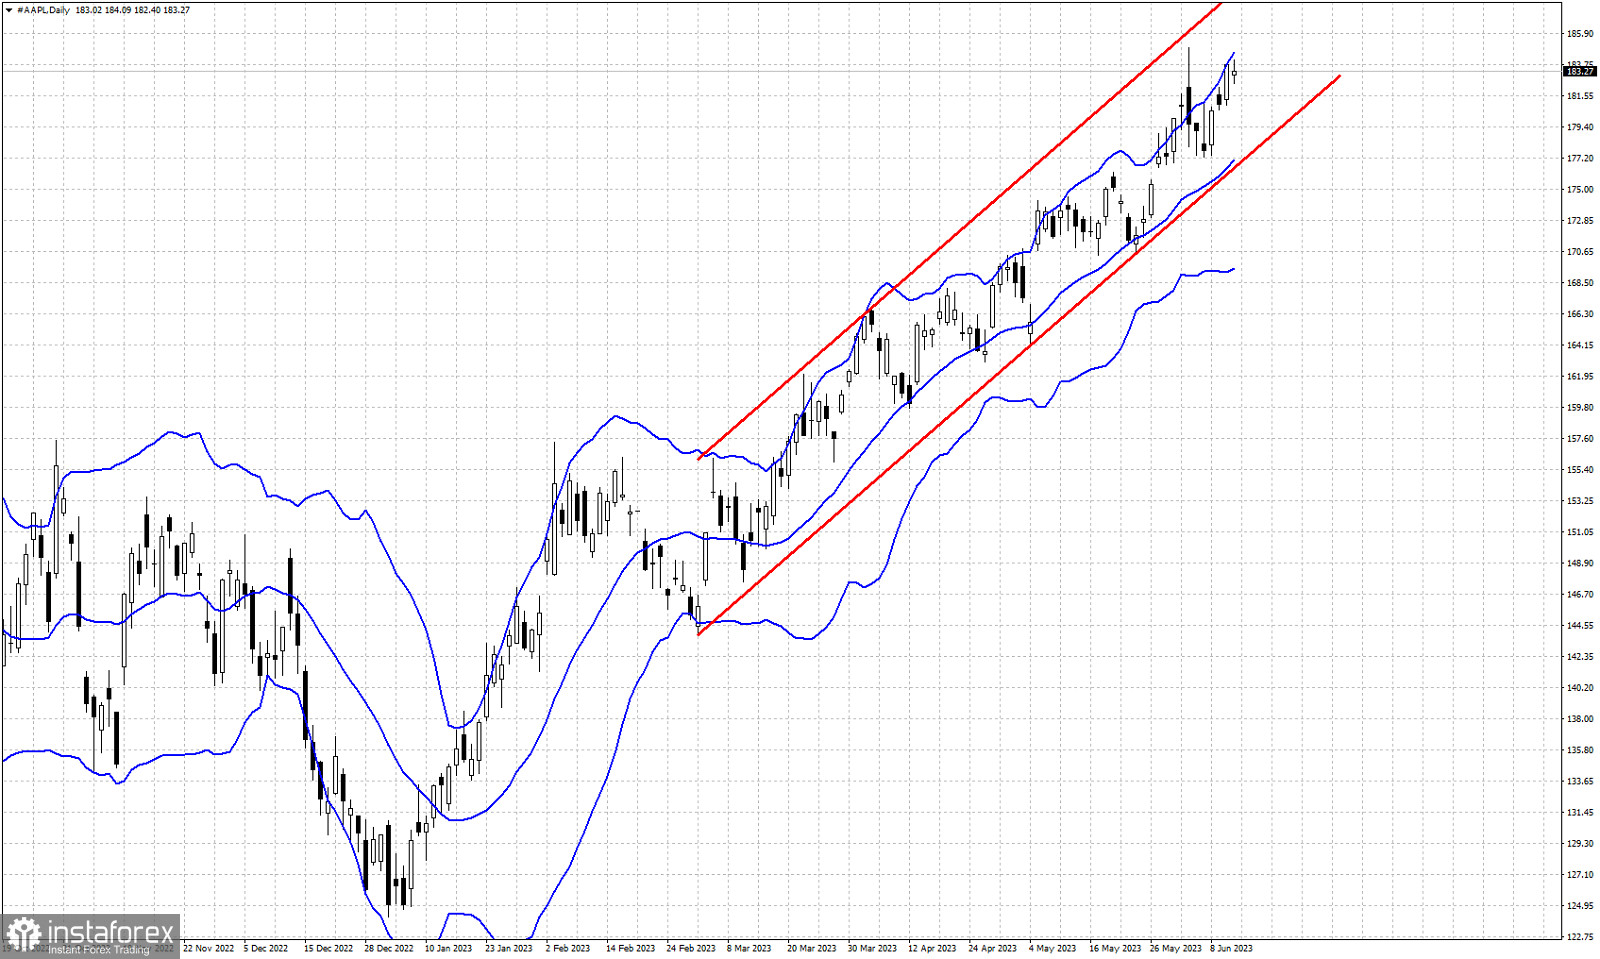
Red lines- bullish channel
blue lines- Bollinger bands
APPLE stock price has been making higher highs and higher lows since February when price was making an intermediate low around $143-$144. Price is trading inside an upward sloping channel since then. AAPL stock price is trading very close to the upper Bollinger band for the last three trading sessions. A pull back towards $177 from $183 is justified. At $177 we find both the middle Bollinger band and the lower channel boundary. Short-term trend remains bullish as long as price holds above $177. A break below $177 will open the way for a bigger pull back with $169-$169.50 as the first target area.
 English
 Русский
 Bahasa Indonesia
 Bahasa Malay
 ไทย
ไทย Español
 Deutsch
 Български
 Français
 Tiếng Việt
 中文
中文 বাংলা
বাংলা हिन्दी
 Čeština
 Українська
 Română

