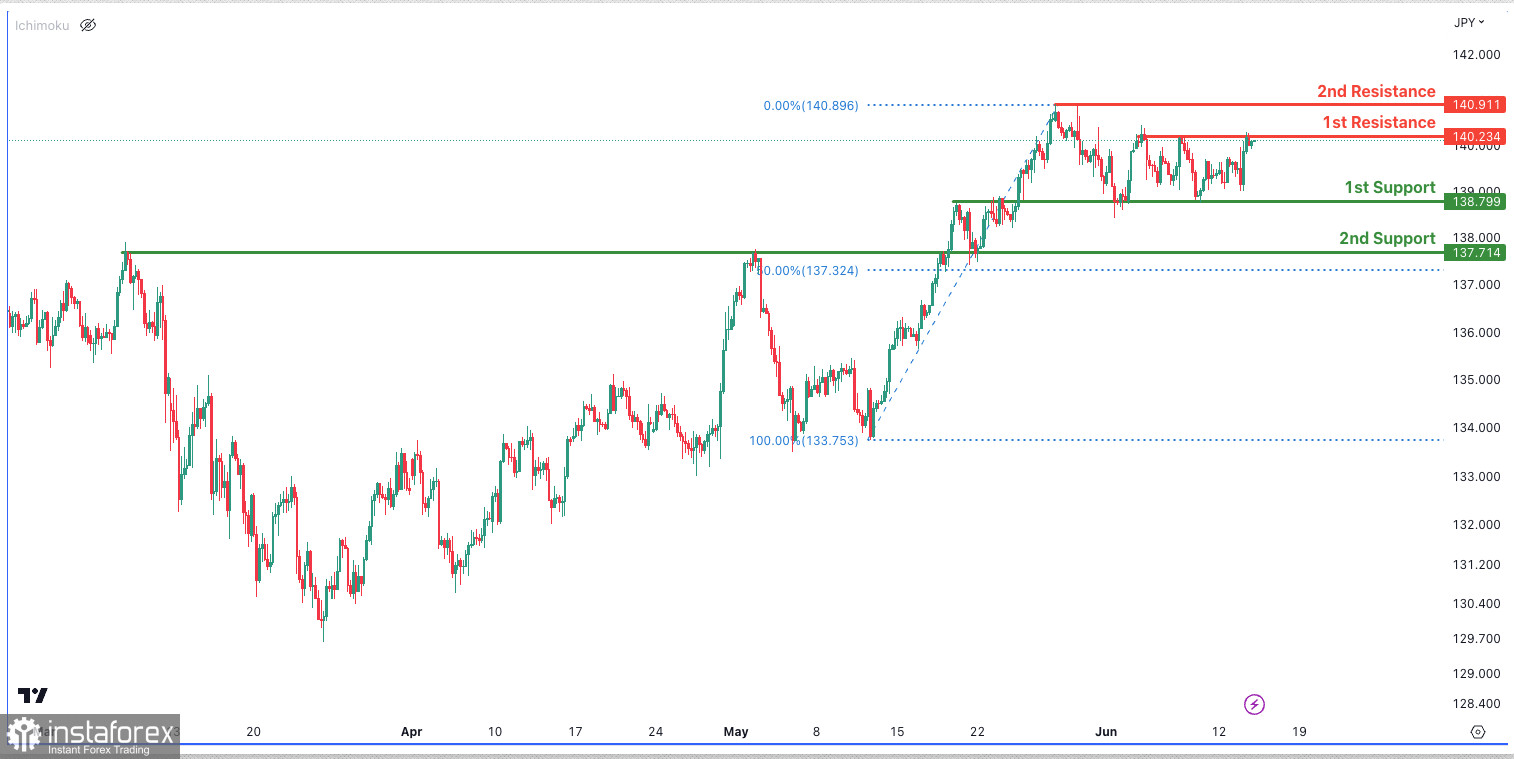
The USD/JPY chart shows bearish momentum, indicating a downward trend.
There is potential for a bearish reaction from the first resistance at 140.23, with a possible decline towards the first support at 138.79.
The first support is an overlap support, while the second support at 137.71 coincides with the 50% Fibonacci retracement.
The first resistance at 140.23 is a significant multi-swing high resistance.
An intermediate resistance at 140.91 adds to its importance as a swing high resistance.
Overall, the chart's bearish momentum suggests a downward bias, and the identified support and resistance levels provide areas to monitor for potential price movements.
 English
 Русский
 Bahasa Indonesia
 Bahasa Malay
 ไทย
ไทย Español
 Deutsch
 Български
 Français
 Tiếng Việt
 中文
中文 বাংলা
বাংলা हिन्दी
 Čeština
 Українська
 Română

